1 Introduction
Cash remains the medium of choice for transactions that are meant to leave no trace, and large banknotes make it especially convenient: one million US dollars in USD 100 notes weighs about ten kilograms, the same value in EUR 500 notes about two (Sands et al., 2016; Rogoff, 2016). This observation underlies a series of decisions to retire large notes—the euro area stopped issuing the EUR 500 in 2019, Canada stopped issuing its CAD 1,000 in 2000 and Singapore its SGD 10,000 in 2014—and, most dramatically, India’s overnight demonetization of 86 percent of its currency by value in November 2016.
In Thailand, the idea of withdrawing the 1,000-baht note resurfaces periodically as a remedy for “grey capital”, “black capital”, vote buying and corruption. The argument is intuitive; its empirical premise is not established. India’s experience is sobering: 99.3 percent of the demonetized value returned to the banking system (Reserve Bank of India, 2018); the cash crunch lowered the growth of economic activity by at least two percentage points in the quarter of the shock (Chodorow-Reich et al., 2020); and although electronic payments expanded (Crouzet et al., 2023), the ratio of currency to GDP returned to its earlier level within a few years (Lahiri, 2020).
This paper asks three questions. What does international experience imply about the effectiveness and costs of demonetization as an instrument against illicit wealth? Under alternative designs, how would retiring the 1,000-baht note affect the stock of illicit cash, the economy and its most vulnerable participants, and the operating costs of the currency system? And if the policy were pursued, how should it be designed, and which empirical questions must be answered first?
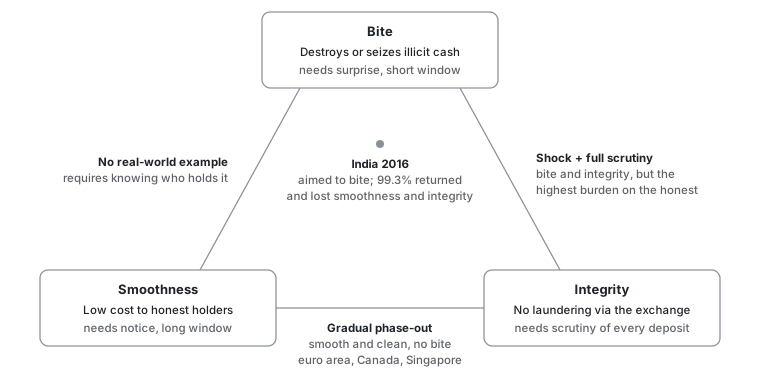
We proceed in three steps. We synthesize twelve episodes into a typology and six stylized facts, and place the 1,000-baht note on a cross-country scale of denomination size. We then develop a stylized model in which the state cannot identify illicit holdings, audit capacity is finite and replacement currency is supplied at a bounded rate. The model yields a conditional impossibility result, the demonetization trilemma: no design simultaneously destroys a large share of illicit cash (bite), spares honest holders (smoothness) and prevents the exchange from becoming a laundering channel (integrity) unless audit capacity exceeds laundering throughput and replacement currency is pre-positioned in secret. Finally, we quantify the trade-offs with DemonetSim-TH, an agent-based model calibrated to India 2016 by approximate Bayesian computation (ABC), and probe it with a global sensitivity analysis.
The results are summarized in the abstract. Three deserve emphasis. First, the bite of a shock design is small even in the calibrated model (median 7.7 percent), and its distribution is right-skewed: large bites arise only when illicit holdings are large relative to the capacity of laundering networks. Second, the most widely cited statistic from India—the 99.3 percent return rate—rules out large-scale extinguishment but is nearly uninformative about the size of the illicit stock. Third, the levers that govern the bite (laundering capacity, illicit share, structuring costs) are disjoint from those that govern disruption (replacement logistics), which is why a phase-out combined with AML measures dominates a shock: it moves the stock through a tighter net without starving the economy of cash.
The paper contributes to three literatures. It adds a formal and quantitative treatment of the stock channel through which demonetization is supposed to work to a debate dominated by arguments about the flow benefits of retiring large notes (Rogoff, 1998; Rogoff, 2016; Sands et al., 2016) and by ex post evaluations of India’s episode (Chodorow-Reich et al., 2020; Lahiri, 2020; Crouzet et al., 2023). It contributes to the economics of crime and money laundering (Becker, 1968; Unger, 2007) by modeling laundering as a capacity-constrained market, which implies that enforcement intensity matters far less than laundering capacity once the latter is abundant. And it adds to the measurement literature on the shadow economy (Tanzi, 1983; Schneider and Enste, 2000; Medina and Schneider, 2018) a non-identification result: aggregate return rates cannot discriminate between small illicit stocks and large but well-laundered ones.
The analysis also draws on several adjacent literatures. Cash in circulation has risen in many economies despite the spread of digital payments, largely because cash is held as a store of value (Bech et al., 2018; Jobst and Stix, 2017), and large notes are disproportionately hoarded or held abroad (Rogoff, 1998). Europol documents the role of high-denomination notes in organized crime (Europol, 2015), while UNODC describes a shift of laundering in East and Southeast Asia toward casinos, underground banking and stablecoins (UNODC, 2024). Work on vote buying emphasizes monitoring and reciprocity rather than denomination (Stokes, 2005; Vicente, 2014), and work on corruption stresses measurement challenges that also afflict the evaluation of demonetization (Olken and Pande, 2012).
Section 2 reviews international evidence and the Thai setting. Section 3 develops the conceptual framework. Section 4 describes the model and its calibration, and Section 5 reports results. Section 6 assesses costs, benefits and designs, and Section 7 sets out a research agenda. Section 8 discusses limitations and Section 9 concludes.
2 International evidence and the Thai setting
2.1 A typology of demonetization
We classify designs along two dimensions: whether the decision is announced in advance, and whether legal-tender status lapses at a deadline or persists. Table 1 distinguishes four designs; the fourth retains the note but restricts the use of cash.
Table 1. A typology of demonetization designs
| Design | Defining features | Examples |
|---|---|---|
| A. Shock | Unannounced; legal tender lapses at announcement; short exchange window | India 2016; Venezuela 2016; Soviet Union 1991; Myanmar 1987 |
| B. Announced, short window | Usable until a deadline, then exchanged; often combined with a redesign | Nigeria 2022–23; Malaysia 1998–99 |
| C. Gradual phase-out | Issuance stops; legal tender persists for years or notes remain redeemable indefinitely | Euro area (EUR 500); Canada (CAD 1,000); Singapore (SGD 10,000); India 2023 (INR 2,000) |
| D. Cash restrictions | Notes retained; caps on cash payments and reporting thresholds | France, Italy, Spain; EU-wide cap of EUR 10,000 from 2027 |
2.2 Twelve episodes
Table 2 summarizes twelve episodes. The evidence is uneven—rigorous evaluations exist essentially only for India 2016—so the table should be read as a structured synthesis rather than a meta-analysis.
Table 2. Demonetization episodes
| Episode | Notes (share of currency) | Design | Stated aims | Main outcomes |
|---|---|---|---|---|
| India 2016 | INR 500 and 1,000 (about 86%) | A | Black money, counterfeits, terror finance; later cashless payments | 99.3% returned; growth at least 2 pp lower in the shock quarter; partly persistent digital adoption |
| Venezuela 2016 | VES 100 | A | Hoarding by cross-border mafias | New notes not ready; unrest; deadline repeatedly extended |
| Soviet Union 1991 | RUB 50 and 100 | A | Speculation, shadow economy | Three-day exchange with caps; collapse of confidence |
| Myanmar 1987 | 25, 35 and 75 kyat | A | Black market | No compensation; most money voided; contributed to the 1988 uprising |
| North Korea 2009 | Redenomination 100:1 | A | Private market activity | Savings wiped out; unrest; official reportedly executed |
| Nigeria 2022–23 | NGN 200, 500, 1,000 (redesign) | B | Counterfeits, hoarding, vote buying, cashless policy | Severe shortages; protests; Supreme Court extended old notes to end-2023 |
| Malaysia 1998–99 | MYR 500 and 1,000 | B | Offshore ringgit, laundering | Limited domestic effects (details to verify) |
| Euro area 2016–19 | EUR 500 (about 28%) | C | Illicit use | No disruption; effect on crime not established |
| Canada 2000/2021 | CAD 1,000 | C | Laundering, organized crime | Smooth; legal tender removed in 2021; redeemable |
| Singapore 2014 | SGD 10,000 | C | Laundering risk (preventive) | Smooth |
| United States 1969 | USD 500–10,000 | C | Lack of use | Smooth; still legal tender |
| India 2023 | INR 2,000 (about 11%) | C | Denomination management | About 97–98% returned within months; no disruption |
Notes: Design letters refer to Table 1. Shares and outcomes are approximate and compiled from memory; they require verification against central-bank and court documents.
Six stylized facts emerge.
Returns are near-complete. Almost all demonetized value returns: 99.3 percent in India 2016 (Reserve Bank of India, 2018) and about 97–98 percent of the INR 2,000 notes withdrawn in 2023. Section 5.3 shows that high returns are consistent with small illicit stocks and with large but laundered ones.
Logistics govern disruption. The crises in India (2016), Venezuela (2016) and Nigeria (2023) were driven by shortfalls of replacement currency.
Incidence is regressive. Costs fall on cash-dependent and informal participants (Chodorow-Reich et al., 2020).
Digital substitution is partial. Electronic payments rise and some adoption persists (Crouzet et al., 2023), but cash demand rebounds (Lahiri, 2020).
Gradual withdrawals are cheap but target flows, not stocks. The euro area, Canada and Singapore reported no disruption, but also made no attempt to extinguish existing illicit holdings (European Central Bank, 2016).
Abrupt designs carry legitimacy risks. Confiscatory or abrupt designs triggered unrest in Myanmar, the Soviet Union, North Korea and Venezuela. India’s Supreme Court upheld the 2016 decision by four to one, the dissent holding that it required legislation (Supreme Court of India, 2023); Nigeria’s Supreme Court extended the validity of old notes.
2.3 The Thai setting
Banknotes in circulation are approximately THB 1.7–2.1 trillion, about 10 percent of GDP, of which the 1,000-baht note accounts for an estimated 65–80 percent by value; our central value of 72 percent implies a stock of about THB 1.37 trillion, or 1.4 billion notes (Bank of Thailand, various years). The note is both the workhorse of ATM dispensing and a household store of value. At roughly USD 28–30 it is worth less than a third of a USD 100 note.
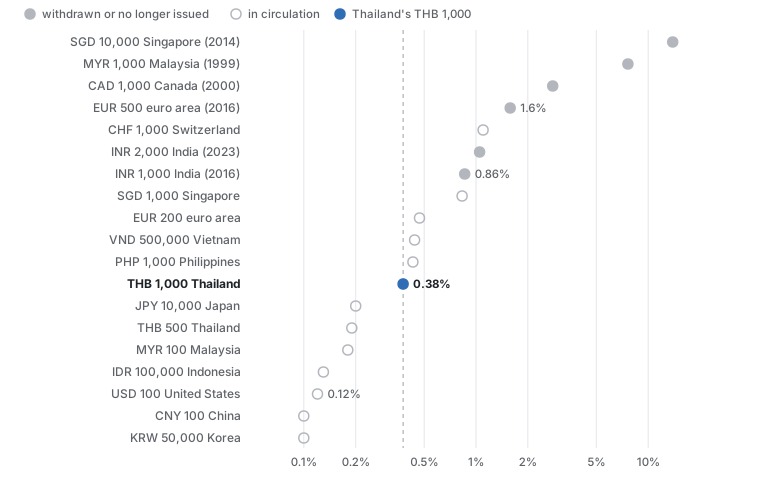
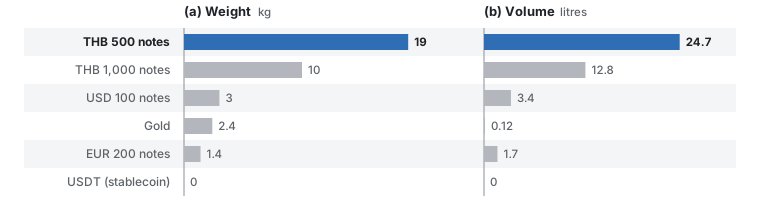
denomination_metrics() in the replication code.Figure 1 places the note on a cross-country scale. At 0.38 percent of GDP per capita—about 1.4 days of average income—it is comparable to the largest notes of the Philippines and Vietnam but between two and thirty-seven times smaller, relative to income, than the notes retired in the euro area, Canada, Singapore, Malaysia and India. The argument that large notes facilitate crime (Rogoff, 2016; Sands et al., 2016) therefore applies to the 1,000-baht note with much less force than to the EUR 500. Figure 2 shows the physical counterpart: withdrawing the note doubles the bulk of large cash payments, from 10 to 19 kilograms per THB 10 million, but leaves far more compact substitutes—US dollar notes, gold and stablecoins—untouched.
bulk_table() in the replication code.Table 3 assesses how much Thailand’s main illicit channels rely on the note. The assessment is qualitative and is itself a hypothesis (H3 in Section 3); much of the modern “grey capital” economy, notably call-centre scams and online gambling, runs through mule accounts and crypto-assets rather than cash.
Table 3. Reliance of illicit channels on the 1,000-baht note (author’s assessment)
| Channel | Reliance on 1,000-baht notes | Expected effect of withdrawal |
|---|---|---|
| Call-centre and online scams | Low: funds move through mule accounts into crypto-assets | Negligible |
| Online gambling | Low: mule accounts and e-wallets | Negligible |
| Narcotics | Medium: cash at retail level; crypto and informal remittance at wholesale level | Higher short-run transport costs |
| Bribery and corruption | Medium to high: large cash transfers, but final stores are assets and nominees | Harder delivery; converted assets untouched |
| Vote buying | Low to medium: per-capita payments of hundreds to a few thousand baht | Small; substitution to 500s, transfers, in-kind gifts |
| Tax evasion by cash businesses | High for cash-held portion | Partial; most can be structured or converted |
| Foreign grey capital and nominees | Low: corporate accounts and real estate | Negligible |
Instruments that target illicit finance more directly already exist: the Currency Act B.E. 2501 (1958), under which the authority to revoke legal-tender status must be examined; the Anti-Money Laundering Act B.E. 2542 (1999), which requires reporting of cash transactions above THB 2 million; the Emergency Decree on Measures for the Prevention and Suppression of Technology Crimes B.E. 2566 (2023), which targets mule accounts; and a 2019 amendment of the Revenue Code that requires financial institutions to report high-frequency electronic receipts. Thailand has no general cap on cash payments, unlike several EU member states and the forthcoming EU-wide limit (European Union, 2024). On the cost side, Thailand is an aged society (roughly one in five citizens is 60 or older), about half of employment is informal, many farmers sell output for cash, several million migrant workers have limited bank access, and baht circulates in border economies of Lao PDR, Cambodia and Myanmar. Digital payments are pervasive (PromptPay operates since 2017) but concentrated among urban, working-age users.
3 Conceptual framework: the demonetization trilemma
3.1 Environment
Let denote the value of the notes to be demonetized and the share held as illicit wealth, so that the illicit stock is . A design specifies a notice period , an exchange window and a legal-tender rule: under a shock legal tender lapses at announcement (); under an announced design it lapses at the deadline; under a phase-out it persists for years and the notes remain redeemable.
Laundering. Illicit holders can convert notes into alternative stores of value (gold, foreign currency, stablecoins, real assets) through intermediaries with aggregate capacity per day at proportional cost , for as long as notes are accepted; structure deposits through money mules with capacity per day at cost ; deposit directly; declare under an amnesty at tax rate ; or abandon the notes. Let denote laundering capacity per day and the period during which laundering channels operate ().
Enforcement. Deposits arrive at rate during the window. The authorities can scrutinize value per day with quality , so the audit probability per unit deposited is , and an illicit unit passing through the banking system is detected with probability , where captures how much harder structured deposits are to flag.
Replacement. When legal tender lapses, a share of the withdrawn value has already been replaced; replacement then proceeds at rate per day.
Objectives. The state cares about the bite , the share of extinguished or captured; the disruption imposed on honest holders; and the laundering share , the share of that enters the financial system undetected.
Assumption 1 (Anonymity). The state cannot identify illicit holdings before they are presented for exchange.
Assumption 2 (Finite capacities). Audit capacity , laundering capacity and the replacement rate are finite.
Assumption 3 (Rational holders). Each illicit holder chooses the channel that maximizes expected retained value; detection destroys a share of the amount, with for criminal proceeds, which carry sanctions beyond confiscation.
Lemma 1 (Liquidity gap). If legal tender lapses when a share of the withdrawn currency has been replaced and replacement proceeds linearly at rate , the cumulative shortfall is (1) and disruption is , where weights the shortfall by the demonetized share of currency and by the cash dependence and digital readiness of transactions in group with weight .
Proof. The integrand is positive on and the integral of a linear function over that interval is . ◻
Proposition 1 (Notice erodes the bite). Suppose laundering weakly dominates the alternatives for every holder, , where and are the cost and detection probability of the laundering channel. If laundering capacity covers the illicit stock, , then no illicit unit is abandoned and the bite is bounded by the detection probability in laundering channels: .
Proof. Under the stated inequality every holder weakly prefers laundering; with the capacity constraint never binds, so all units are laundered. Extinguishment is zero, and the captured share equals times the confiscated share . ◻
Proposition 2 (Congestion). If , the audit probability is strictly increasing in . Shortening the window to deny laundering time therefore lowers the probability that a deposited unit is examined and raises the undetected share of illicit value passing through the banking system.
Proof. Immediate from . ◻
Proposition 3 (Demonetization trilemma). Fix thresholds , and , and suppose that a positive share of illicit value passes through the banking system. Under Assumptions 1–3, a design attains , and only if (2) Conditions (i) and (ii) are jointly feasible only if : audit capacity must exceed laundering throughput scaled by the inverse illicit share. Under a shock, condition (iii) requires : replacement currency must be printed and distributed before the announcement. When either requirement fails, at most two of the three objectives can be met.
Proof sketch. Condition (i) follows from Proposition 1: if the bite cannot exceed . For illicit value passing through banks the undetected share is , so requires , which with yields (ii). Combining (i), with , and (ii) gives , which is non-empty only under the stated bound on . Condition (iii) follows from Lemma 1. ◻
Remark 1. The trilemma concerns designs that rely on the exchange of notes to separate illicit from licit holdings. India’s 2016 design partly satisfied (i), but scrutiny of the deposit flood was necessarily ex post and partial, and replacement currency was far from sufficient; the predicted combination—low bite, high disruption, substantial legitimization—is what the episode delivered. A phase-out relaxes (ii) and (iii) at the price of (i); Figure 3 summarizes the three corners.
3.2 Testable implications
Hypothesis 1 (Non-identification). Aggregate return rates do not identify when is large relative to .
Hypothesis 2 (Capacity). The bite is decreasing in laundering capacity; scrutiny has first-order effects on the bite only when .
Hypothesis 3 (Denomination premium). If the 1,000-baht note is a preferred illicit medium, its share in seized cash exceeds its share in circulation.
Hypothesis 4 (Political money cycle). If vote buying relies on large notes, demand for 1,000-baht notes rises disproportionately before elections.
Hypotheses 1 and 2 are examined with the model in Section 5; Hypotheses 3 and 4 require new data and motivate the designs in Section 7.
4 DemonetSim-TH: model and calibration
4.1 Structure
DemonetSim-TH is a partial-equilibrium Monte Carlo model with two modules. Uncertain parameters are drawn 600 times per scenario; each draw simulates six groups of honest holders and 1,500 illicit agents. Parameter ranges are reported in Appendix A.
Honest holders. Group holds share of the demonetized stock and has bank access , digital readiness , cash dependence and transaction weight (Table 10). The share converted before the window closes is (3) with days, so stricter documentation slows down holders with poor bank access. The disruption index applies Lemma 1, (4) where if legal tender persists to the deadline, under a phase-out, and is the mean disruption of the India prior draws.
Illicit holders. Holdings , measured in units of the scrutiny threshold, are log-normal with parameters and , so that a small number of large holders own most illicit value. A holder is “black” (criminal proceeds) with probability , in which case detection costs times the amount, or “grey” (undeclared legal income) with ; the state recovers . Perceived risk is scaled by . The values of the five channels are (5) and holder chooses with (McFadden, 1974). Structuring and conversion are capacity-constrained: their capacities, expressed as shares of all demonetized cash over the operating period, are divided by to obtain capacities relative to illicit holdings. Agents are processed in random order, and those who find their preferred channel full fall back to their next-best option (Appendix Table 12). Detected deposits are captured or regularized after penalty; undetected deposits and structured deposits net of fees are laundered; conversions and fees are displaced; abandoned notes are extinguished. The bite is extinguished plus captured value, and the return rate is .
4.2 Scenarios
Table 4 defines four Thai scenarios and the India calibration scenario. S2 captures the main Nigerian risk—insufficient replacement currency at the deadline—through a wide range for and ; S4 adds a package of cash-payment caps, enhanced due diligence on gold, crypto and property purchases and a crackdown on mule accounts, modeled as higher detection and lower laundering capacity.
Table 4. Scenarios
| Code | Scenario | Key features |
|---|---|---|
| S1 | Shock (India-style) | Legal tender lapses at once; 50-day window; amnesty at 50–60% tax |
| S2 | Announced, 90-day deadline | Usable until the deadline; no amnesty; outcome depends on printing enough 500-baht notes |
| S3 | Phase-out, 5 years | Issuance stops; legal tender for five years; redeemable at the central bank indefinitely |
| S4 | Phase-out + AML package | S3 plus cash-payment cap, enhanced due diligence on dealers, mule-account crackdown |
| IN16 | India 2016 (calibration) | Indian parameters; draws retained by ABC if the simulated return rate is |
4.3 Calibration and sensitivity analysis
We treat India 2016 as the calibration target. We draw 4,000 parameter vectors from the IN16 priors, simulate the return rate, and retain draws with (Beaumont et al., 2002). Of the 4,000 draws, 1,214 (30.3 percent) are accepted. To understand which inputs drive the outcomes, we compute partial rank correlation coefficients (PRCC) between each of 13 sampled parameters and three outcomes across the 600 S1 draws (Marino et al., 2008). PRCCs measure the monotone association between an input and an outcome after removing the linear effects of all other inputs on the ranks; with 39 coefficients estimated from 600 draws, values below about 0.15 in absolute value are within sampling noise.
5 Results
5.1 Bite versus disruption
Table 5 and Figure 4 report the central results. A Thai shock (S1) produces a disruption index of 17 against 97 for calibrated India—about one sixth—because the 1,000-baht note is a smaller share of currency and digital readiness is far higher. Incidence is nonetheless highly regressive: about 91 percent of the disruption falls on vulnerable households and informal businesses (81 percent in India). Honest holders fail to convert about 0.28 percent of the stock, roughly THB 3.9 billion, three quarters of it held across the border. S2 is benign at the median but reaches an index of about 10 in the worst decile of replacement outcomes, which is precisely the Nigerian failure mode.
Table 5. Main simulation results
| Disruption index | Bite (%) | Laundered (%) | Displaced (%) | Return rate (%) | |
|---|---|---|---|---|---|
| IN16 (calibrated) | 96.8 [85.4, 113.2] | 8.5 [6.2, 12.0] | 60.2 | 27.8 | 99.50 |
| S1 Shock | 17.2 [13.2, 23.9] | 7.7 [5.5, 15.4] | 60.9 | 25.2 | 99.63 |
| S2 Announced, 90 days | 0.4 [0.0, 3.8] | 3.4 [2.7, 4.1] | 30.0 | 65.5 | 99.98 |
| S3 Phase-out | 0.0 [0.0, 0.0] | 1.0 [0.9, 1.2] | 52.9 | 45.8 | 100.00 |
| S4 Phase-out + AML | 0.0 [0.0, 0.0] | 6.1 [4.8, 7.5] | 67.4 | 24.7 | 100.00 |
Notes: Medians with interquartile ranges in brackets over 600 draws per scenario (IN16: ABC-accepted draws). Laundered and displaced are means, in percent of the illicit stock. Bootstrap standard errors of the medians (1,000 resamples) are 0.25 pp for the S1 and IN16 bites, 0.09 pp for S4, and 0.42 for the S1 disruption index.
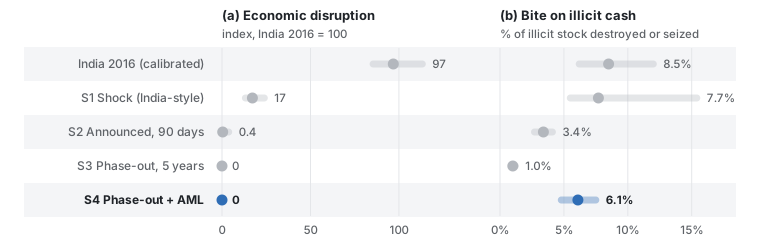
scenario_summary.csv.The median bite of a shock is 7.7 percent; a phase-out combined with AML measures attains 6.1 percent at no liquidity cost. The comparison should not be over-read: S4’s bite stems from assumed improvements in detection that could be pursued without withdrawing the note. What the phase-out adds is to force the stock through that tighter net within a known horizon.
5.2 Where illicit cash goes
Figure 5 decomposes the fate of illicit cash. In every scenario most of it survives: between 30 and 67 percent enters the banking system undetected and between 25 and 65 percent is displaced into gold, foreign currency and crypto-assets or absorbed as fees by laundering intermediaries. Advance notice (S2) maximizes displacement, because notes remain spendable while holders buy alternative assets. Amnesty is almost never used (about 1 percent of illicit value): at 50–60 percent it is more expensive than laundering, which matches the weak take-up of India’s 2016 scheme. The distribution of the bite is right-skewed; in the best decile of draws a shock destroys or seizes more than 24 percent, which happens only when the illicit stock is large and laundering capacity scarce.
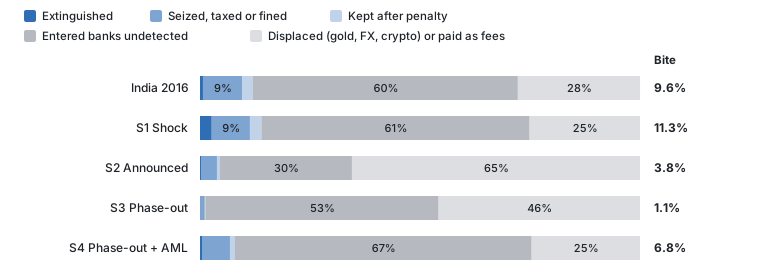
mc_results.csv.5.3 What India’s return rate can and cannot tell us
Figure 6 plots the simulated return rate against the assumed illicit share for the India prior draws. The acceptance region overlaps the simulated distribution at every illicit share between 3 and 29 percent. Table 6 compares prior and posterior distributions: the posterior median of the illicit share (13.0 percent) barely differs from the prior (15.7 percent), and the 10–90 percent interval shrinks only from 4.8–27.1 to 4.2–25.9 percent. The return rate does trim the upper tail of the bite, from 23.8 to 15.9 percent at the 90th percentile. In short, the 99.3 percent statistic rules out large-scale extinguishment, but it is nearly uninformative about the illicit stock (Hypothesis 1).
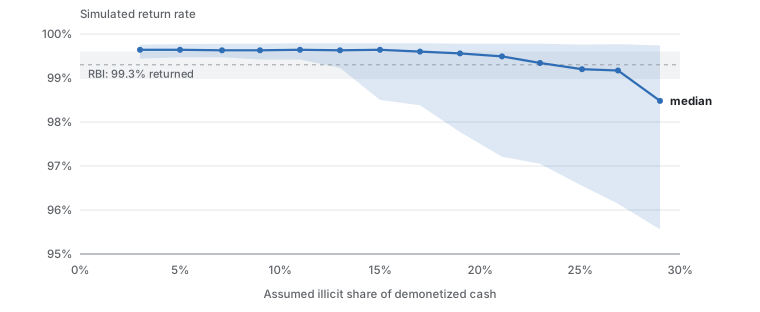
india_calibration_curve.csv; the target is from Reserve Bank of India (2018).Table 6. Approximate Bayesian computation: prior versus posterior
| Quantity (%) | Prior: median [p10, p90] | Posterior: median [p10, p90] |
|---|---|---|
| Illicit share of demonetized cash, | 15.7 [4.8, 27.1] | 13.0 [4.2, 25.9] |
| Bite | 9.3 [5.0, 23.8] | 8.5 [4.7, 15.9] |
| Laundered undetected | 61.8 [46.9, 73.9] | 62.0 [46.1, 72.8] |
| Displaced | 22.0 [12.6, 39.6] | 25.0 [14.3, 44.2] |
Notes: 4,000 prior draws; 1,214 accepted with .
5.4 The binding constraint: laundering capacity
Figure 7 fixes the illicit share at 10 percent and varies laundering capacity. When the laundering network can absorb only 1 percent of demonetized cash during the window, stricter scrutiny raises the bite from 18 to 41 percent. Once capacity exceeds about 7.5 percent—roughly the illicit stock net of conversion capacity—the bite falls to 5–7 percent irrespective of scrutiny, as Proposition 1 predicts (Hypothesis 2). Disrupting mule networks, cash purchases of gold and peer-to-peer crypto markets is therefore a precondition for, not a complement to, any design that aims at the stock.
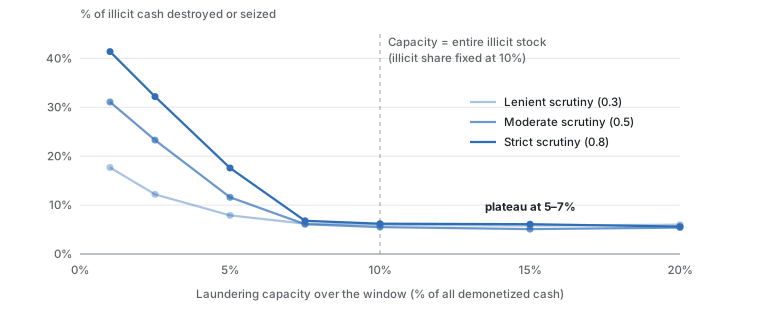
sensitivity_s1.csv.5.5 Global sensitivity
Figure 8 reports PRCCs for the shock scenario. The bite is governed by the ratio of the illicit stock to laundering capacity: the illicit share and structuring capacity have PRCCs of and ; the detectability of structured deposits () and the costs of structuring and conversion (, ) follow, while bank scrutiny intensity has a coefficient of only . The laundering share responds to capacity (), fees () and scrutiny (): scrutiny matters for integrity far more than for bite. Disruption depends almost exclusively on the replacement rate () and on currency ready on day zero (). The levers of bite and disruption are thus disjoint, consistent with Lemma 1 and Proposition 3.
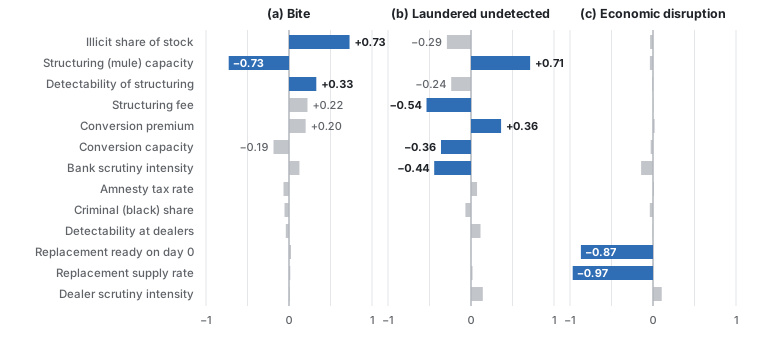
prcc_s1.json.5.6 Operating costs
Table 7 reports the operating costs of replacing the note. Together they amount to less than 0.1 percent of GDP. The real costs of the policy are the disruption, its incidence and the risk to confidence in the baht, not printing.
Table 7. Operating costs of replacing the 1,000-baht note
| Item | Median | 5th–95th percentile |
|---|---|---|
| 1,000-baht notes withdrawn (billion) | 1.37 | 1.19–1.58 |
| 500- and 100-baht notes printed (billion) | 2.27 | 1.76–2.83 |
| Initial printing cost (THB billion) | 5.7 | 3.6–8.2 |
| Additional annual printing cost (THB billion) | 0.8 | 0.2–1.7 |
| Seigniorage shifted per year (THB billion) | 9.1 | 5.3–14.6 |
| One-off ATM reconfiguration (THB billion) | 0.3 | 0.1–0.5 |
Notes: 5,000 Monte Carlo draws over assumed ranges of currency in circulation, the 1,000-baht share, demand migration, unit printing costs, note lifetimes and interest rates.
6 Assessment and policy design
6.1 Costs and benefits
Figure 9 and Table 8 position each claimed benefit and cost by impact and strength of evidence. The largest costs—disruption of the informal economy and its regressive incidence—rest on strong evidence; every benefit is either small or weakly evidenced. The strongest argument in favor of withdrawal is dynamic: without large notes, bribery and hoarding become costlier every year, and societies may grow accustomed to traceable payments (Rogoff, 2016; Sands et al., 2016). These flow effects lie outside the model and are a priority for research.
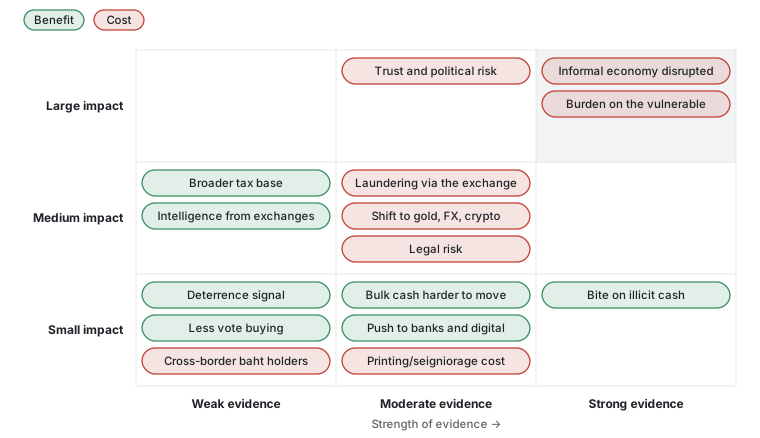
Table 8. Benefits and costs of withdrawal (author’s assessment)
| Item | Impact | Evidence | Basis |
|---|---|---|---|
| Costs | |||
| Informal economy disrupted (shock) | Large | Strong | Chodorow-Reich et al. (2020) |
| Burden on vulnerable groups | Large | Strong | India evidence; about 90% of simulated disruption |
| Trust and political risk | Large | Moderate | Myanmar 1987, Soviet Union 1991, Venezuela 2016, Nigeria 2023 |
| Laundering via the exchange | Medium | Moderate | 30–67% of illicit cash enters banks undetected (model) |
| Displacement to gold, FX, crypto | Medium | Moderate | 25–65% displaced (model) |
| Legal risk | Medium | Moderate | Indian (4–1) and Nigerian Supreme Court rulings |
| Printing and seigniorage | Small | Moderate | About THB 6 billion once and THB 10 billion a year |
| Cross-border baht holders | Small | Weak | No data |
| Benefits | |||
| Broader tax base | Medium | Weak | Indian filings rose, confounded by the GST |
| Intelligence from exchanges | Medium | Weak | Depends on analytical capacity |
| Bite on illicit cash | Small | Strong | 99.3% returned in India; 1–11% in the model |
| Bulk cash harder to move | Small | Moderate | 10 to 19 kg per THB 10 million |
| Push to banks and digital payments | Small | Moderate | Crouzet et al. (2023); Thailand already highly digital |
| Deterrence signal | Small | Weak | No systematic evidence |
| Less vote buying | Small | Weak | Payments small; substitution to 500s and in-kind gifts |
6.2 Comparative evaluation
Figure 10 scores five options against seven criteria. With equal weights the shock design scores lowest (1.7 of 5) and the AML-based options highest (3.7–3.9). Doubling the weight on the bite makes the phase-out with AML (C+) the top option; even with a fivefold weight on the bite, the shock design remains last. Because the scores are judgments, the ranking should be read as a structured summary of the preceding evidence rather than as an independent result.
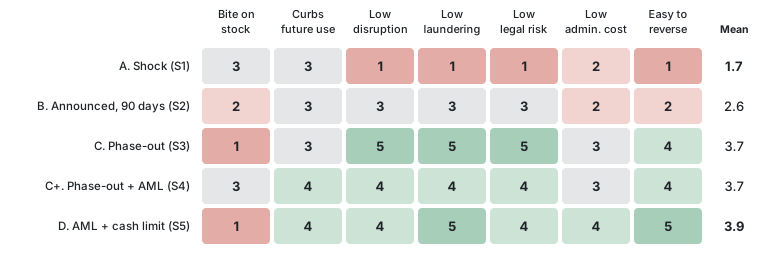
6.3 A gated phase-out
If the note is to be withdrawn, Figure 11 outlines a five-year phase-out with three decision gates at which the process can be paused or reversed; reversal remains possible because the note stays legal tender until the final phase. Five preconditions should be met before the first gate: (1) evidence that the note carries a premium in illicit use (Section 7); (2) a demonstrable reduction in laundering capacity—mule accounts, cash purchases of gold, peer-to-peer crypto markets and nominee structures; (3) adequate stocks of 500-baht notes and reconfigured ATMs; (4) a statutory basis and exchange channels for the elderly, rural residents and holders in neighboring countries; and (5) an independent evaluation plan with monthly open data by denomination. Four designs should be avoided: surprise announcements; per-person exchange caps low enough to strand honest holders; simultaneous redesigns that create shortages; and amnesties priced above market laundering fees, which attract almost no declarations.
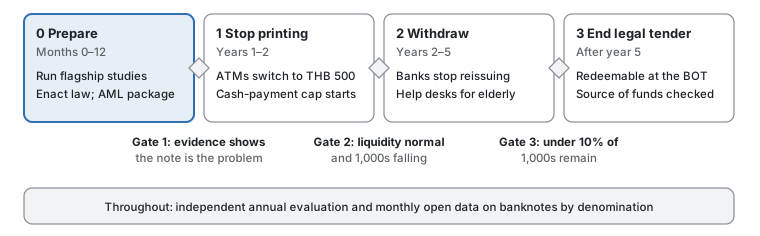
7 A research agenda
Fifteen research topics follow from the analysis (Table 9 and Figure 12). Three flagship studies address the premise of the policy directly and are described in detail below.
Table 9. Research agenda
| ID | Topic | Question | Design and data |
|---|---|---|---|
| A1 | Who holds 1,000s | How much demand reflects transactions, hoarding or the informal economy? | Cash-demand models (ARDL), note return frequencies; BOT data |
| A2 | Shadow economy | How has the shadow economy changed with digital payments? | MIMIC and currency-demand approaches (Tanzi, 1983; Medina and Schneider, 2018) |
| A3 | Pre-election cash | Does demand for 1,000s and 500s rise before elections? | Local projections, placebo dates; monthly data by denomination |
| B1 | Cross-country | Which conditions make demonetization succeed or fail? | fsQCA (Ragin, 2008); synthetic control (Abadie et al., 2010) |
| B2 | Symbolic politics | Why choose low-yield, high-salience instruments? | Discourse and voting analysis |
| C1 | Distributional costs | Who bears the costs, and how much? | Microsimulation; household surveys |
| C2 | Public acceptance | Which designs do citizens accept? | Conjoint experiment (Hainmueller et al., 2014) |
| C3 | Cross-border baht | How much baht is held in Lao PDR, Cambodia, Myanmar? | Border-market surveys |
| D1 | Seized-cash premium | Is the 1,000’s share in seized cash above its circulation share? | Content analysis of judgments and seizure reports |
| D2 | Vote-buying modes | Which notes, transfers or goods buy votes? | List experiment (Blair and Imai, 2012) |
| D3 | Displacement and mules | What is the laundering capacity of mule networks? | Network and on-chain analysis; partnership data |
| E1 | Legal authority | Secondary legislation or an Act of Parliament? | Comparative law; proportionality |
| E2 | Cash caps | Do cash-payment caps shrink the shadow economy? | Natural experiments from Italian caps |
| F1 | E-payment bunching | Do merchants stay below reporting thresholds and revert to cash? | Bunching estimation (Saez, 2010; Kleven, 2016) |
| F2 | Model extensions | Does the trilemma survive richer models? | ABM, heterogeneous-agent and game-theoretic models |
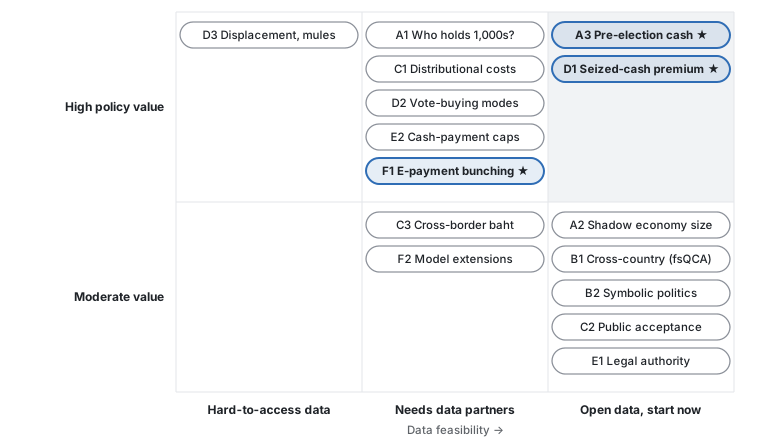
7.1 D1: an illicit denomination premium
Let be the value share of 1,000-baht notes in the cash seized in case , and the share of the note in circulation at the seizure date . The estimand is the premium by crime type, . We propose a fractional logit (Papke and Wooldridge, 1996), (6) estimated on a sample of 300 to 1,000 judgments and seizure reports that record denominations, with region and enforcement-channel controls . Hypothesis 3 predicts for bribery and wholesale narcotics. The main threat is selection into detection; reporting estimates separately by detection channel and bounding the premium under alternative selection assumptions mitigates it. A premium indistinguishable from zero would remove the empirical premise of the policy.
7.2 A3: a political money cycle
Let be notes in circulation of denomination in month . Local projections (Jordà, 2005), (7) trace the response to the pre-election period , controlling for New Year, Chinese New Year and Songkran, the policy rate and lags, and checked against placebo dates. With regional data, a difference-in-differences design interacts the pre-election period with electoral competitiveness. If while , vote buying runs on smaller notes and withdrawing the 1,000-baht note is mis-targeted (Hypothesis 4).
7.3 F1: bunching at e-payment reporting thresholds
Financial institutions report accounts that receive at least 3,000 electronic transfers a year, or at least 400 transfers totaling THB 2 million (thresholds to be verified). If merchants avoid reporting by steering customers to cash, the distribution of annual transfer counts will exhibit excess mass below the thresholds. Following Saez (2010), Kleven and Waseem (2013) and Kleven (2016), the normalized excess mass is (8) where is the number of accounts in bin , the counterfactual from a polynomial fitted outside the excluded window and the counterfactual density at the threshold . Evidence of bunching would indicate that tax-reporting rules push merchants back to cash, so currency and tax policy must be designed jointly.
8 Limitations
Five limitations qualify the results. First, the Thai statistics are approximations that have not been verified against primary sources. Second, the model is partial-equilibrium: it omits general-equilibrium feedbacks, dynamic responses of the central bank and the long-run flow effects of retiring large notes, which are the strongest argument in favor of withdrawal. Third, the illicit share is unknown; we therefore report results as distributions over wide priors, and the India calibration shows that available aggregate data cannot narrow it. Fourth, detection is modeled in reduced form; in particular, the compliance costs of the AML package in S4 for honest users are not quantified. Fifth, the scorecard and the evidence map are qualitative judgments, and external validity of a calibration to India rests on the assumption that laundering technologies are broadly similar.
9 Conclusion
A shock withdrawal of the 1,000-baht note would likely do more harm than good: in the calibrated model it destroys or seizes about 8 percent of illicit cash, concentrates about 90 percent of the disruption on vulnerable groups and turns the exchange into a large-scale laundering channel. The note is not a large denomination by international standards, and Thailand’s grey capital increasingly moves through digital channels. The binding constraint on any design is the capacity of laundering networks, which points to mule accounts, cash purchases of gold, peer-to-peer crypto markets and nominee structures as the more promising targets, together with caps on cash payments. If withdrawal is nonetheless pursued, a gated five-year phase-out preceded by the three flagship studies would test the premise before the costs are incurred.
References
Abadie, A., Diamond, A., and Hainmueller, J. (2010). Synthetic control methods for comparative case studies. Journal of the American Statistical Association, 105(490):493–505.
Bank of Thailand (various years). Banknotes in circulation by denomination; Payment Systems Report. Bangkok.
Beaumont, M. A., Zhang, W., and Balding, D. J. (2002). Approximate Bayesian computation in population genetics. Genetics, 162(4):2025–2035.
Bech, M., Faruqui, U., Ougaard, F., and Picillo, C. (2018). Payments are a-changin’ but cash still rules. BIS Quarterly Review, March.
Becker, G. S. (1968). Crime and punishment: An economic approach. Journal of Political Economy, 76(2):169–217.
Blair, G. and Imai, K. (2012). Statistical analysis of list experiments. Political Analysis, 20(1):47–77.
Chodorow-Reich, G., Gopinath, G., Mishra, P., and Narayanan, A. (2020). Cash and the economy: Evidence from India’s demonetization. Quarterly Journal of Economics, 135(1):57–103.
Crouzet, N., Gupta, A., and Mezzanotti, F. (2023). Shocks and technology adoption: Evidence from electronic payment systems. Journal of Political Economy, 131(11).
European Central Bank (2016). ECB ends production and issuance of EUR 500 banknote. Press release, 4 May.
European Union (2024). Regulation (EU) 2024/1624 on the prevention of the use of the financial system for the purposes of money laundering or terrorist financing.
Europol (2015). Why Is Cash Still King? A Strategic Report on the Use of Cash by Criminal Groups as a Facilitator for Money Laundering. The Hague.
FATF and APG (2017). Anti-Money Laundering and Counter-Terrorist Financing Measures—Thailand: Mutual Evaluation Report.
Hainmueller, J., Hopkins, D. J., and Yamamoto, T. (2014). Causal inference in conjoint analysis. Political Analysis, 22(1):1–30.
Jobst, C. and Stix, H. (2017). Is cash back? Assessing the recent increase in cash demand. SUERF Policy Note 19.
Jordà, Ò. (2005). Estimation and inference of impulse responses by local projections. American Economic Review, 95(1):161–182.
Kleven, H. J. (2016). Bunching. Annual Review of Economics, 8:435–464.
Kleven, H. J. and Waseem, M. (2013). Using notches to uncover optimization frictions and structural elasticities: Theory and evidence from Pakistan. Quarterly Journal of Economics, 128(2):669–723.
Lahiri, A. (2020). The great Indian demonetization. Journal of Economic Perspectives, 34(1):55–74.
Marino, S., Hogue, I. B., Ray, C. J., and Kirschner, D. E. (2008). A methodology for performing global uncertainty and sensitivity analysis in systems biology. Journal of Theoretical Biology, 254(1):178–196.
McFadden, D. (1974). Conditional logit analysis of qualitative choice behavior. In Zarembka, P. (ed.), Frontiers in Econometrics, 105–142. Academic Press.
Medina, L. and Schneider, F. (2018). Shadow economies around the world: What did we learn over the last 20 years? IMF Working Paper WP/18/17.
Olken, B. A. and Pande, R. (2012). Corruption in developing countries. Annual Review of Economics, 4:479–509.
Papke, L. E. and Wooldridge, J. M. (1996). Econometric methods for fractional response variables with an application to 401(k) plan participation rates. Journal of Applied Econometrics, 11(6):619–632.
Ragin, C. C. (2008). Redesigning Social Inquiry: Fuzzy Sets and Beyond. University of Chicago Press.
Reserve Bank of India (2018). Annual Report 2017–18. Mumbai.
Rogoff, K. (1998). Blessing or curse? Foreign and underground demand for euro notes. Economic Policy, 13(26):261–303.
Rogoff, K. S. (2016). The Curse of Cash. Princeton University Press.
Saez, E. (2010). Do taxpayers bunch at kink points? American Economic Journal: Economic Policy, 2(3):180–212.
Sands, P., Campbell, H., Keatinge, T., and Weisman, B. (2016). Making it harder for the bad guys: The case for eliminating high denomination notes. M-RCBG Associate Working Paper 52, Harvard Kennedy School.
Schneider, F. and Enste, D. H. (2000). Shadow economies: Size, causes, and consequences. Journal of Economic Literature, 38(1):77–114.
Stokes, S. C. (2005). Perverse accountability: A formal model of machine politics with evidence from Argentina. American Political Science Review, 99(3):315–325.
Supreme Court of India (2023). Vivek Narayan Sharma v. Union of India, judgment of 2 January 2023.
Tanzi, V. (1983). The underground economy in the United States: Annual estimates, 1930–80. IMF Staff Papers, 30(2):283–305.
Unger, B. (2007). The Scale and Impacts of Money Laundering. Edward Elgar.
UNODC (2024). Casinos, Money Laundering, Underground Banking, and Transnational Organized Crime in East and Southeast Asia: A Hidden and Accelerating Threat. Vienna.
Vicente, P. C. (2014). Is vote buying effective? Evidence from a field experiment in West Africa. Economic Journal, 124(574):F356–F387.
Appendix A. Model details
Table 10. Holder groups: shares and behavioral parameters
| Thailand | India 2016 | |||||||||
|---|---|---|---|---|---|---|---|---|---|---|
| 2-6(l)7-11 Group | ||||||||||
| Formal households | 0.32 | 0.30 | 0.95 | 0.85 | 0.35 | 0.20 | 0.20 | 0.80 | 0.30 | 0.60 |
| Vulnerable households | 0.17 | 0.20 | 0.55 | 0.35 | 0.80 | 0.27 | 0.30 | 0.45 | 0.05 | 0.95 |
| Formal firms | 0.08 | 0.25 | 1.00 | 0.90 | 0.25 | 0.08 | 0.20 | 1.00 | 0.50 | 0.40 |
| Informal businesses | 0.20 | 0.25 | 0.60 | 0.50 | 0.85 | 0.30 | 0.30 | 0.55 | 0.05 | 0.95 |
| Cross-border holders | 0.05 | 0.00 | 0.30 | 0.20 | 0.70 | 0.02 | 0.00 | 0.30 | 0.10 | 0.80 |
| Banks and ATMs | 0.08 | 0.00 | 1.00 | 1.00 | 0.00 | 0.03 | 0.00 | 1.00 | 1.00 | 0.00 |
Notes: : share of the demonetized stock (summing to 0.90 at an illicit share of 0.10 and rescaled otherwise); : transaction weight; : bank access; : digital readiness; : cash dependence. Access, readiness and dependence receive multiplicative noise in each draw.
Table 11. Parameter ranges (uniform priors)
| Parameter | S1 | S2 | S3 | S4 | IN16 |
|---|---|---|---|---|---|
| Window or legal-tender period (days) | 50 | 90 | 1,825 | 1,825 | 50 |
| Demonetized share of currency | 0.72 | 0.72 | 0.72 | 0.72 | 0.86 |
| Bank scrutiny | 0.35–0.65 | 0.30–0.60 | 0.20–0.40 | 0.50–0.80 | 0.25–0.55 |
| Dealer scrutiny | 0.20–0.40 | 0.20–0.40 | 0.10–0.30 | 0.50–0.80 | 0.10–0.30 |
| Structuring fee | 10–30% | 5–20% | 0–3% | 3–10% | 15–35% |
| Structuring capacity (% of stock per day) | 0.05–0.30 | 0.05–0.25 | 0.008–0.022 | 0.003–0.008 | 0.05–0.40 |
| Conversion premium | 15–40% | 3–10% | 1–4% | 5–15% | 15–40% |
| Amnesty tax | 50–60% | none | none | none | 50–60% |
| Illicit share | 4–20% | 4–20% | 4–20% | 4–20% | 2–30% |
| Replacement rate (% per day) | 0.4–1.5 | 0.3–1.2 | – | – | 0.4–0.7 |
Notes: Common to all scenarios: black share ; detectability of structuring and of conversion unless stated in the code; holdings ; days; Gumbel scale 0.02.
Table 12. Capacity-constrained allocation
| 1. | Draw holdings , types, loss parameters , risk multipliers and fees; compute from (5) and add Gumbel noise. |
| 2. | Set structuring and conversion capacities as shares of illicit holdings; draw a random processing order. |
| 3. | For up to five rounds: each unassigned agent selects its best available channel. Unconstrained channels (deposit, amnesty, abandonment) accept immediately; for each constrained channel, accept agents in processing order while cumulative holdings do not exceed remaining capacity, and remove the channel from the choice set of rejected agents. |
| 4. | Compute value-weighted shares of extinguished, captured, regularized, laundered and displaced value. |
Appendix B. Replication
The model is implemented in demonet_sim_th.py (Python 3 with NumPy, pandas and Matplotlib). The command python demonet_sim_th.py --draws 600 --seed 7 --out out reproduces all simulation results, writing ten CSV files and six PNG figures; the PRCC coefficients are computed from mc_results.csv. Before any policy use, the denomination data, holder parameters, logistics ranges and scenario priors must be replaced with verified values; the items most in need of verification are the stock of banknotes by denomination, the reporting thresholds under Thai AML and tax law, and the episode-level figures in Table 2.