1 Introduction
A tropical cyclone that strengthens by 30 kt or more within a day leaves communities less time to prepare than its earlier forecast implied. This rapid intensification (RI) is uncommon, but most intense storms pass through it (Lee et al. 2016), and intensification rates have increased in recent decades (Bhatia et al. 2019). RI just before landfall matters most for warnings, and warming is expected to make it more frequent (Emanuel 2017). Statistical RI guidance has relied on environmental and persistence predictors since Kaplan and DeMaria (2003) and Kaplan et al. (2010), mainly for the Atlantic and eastern Pacific. Deep learning on satellite imagery is now an active line of work, supported by long image archives such as Digital Typhoon (Kitamoto et al. 2023).
Two gaps motivate this paper. The first is descriptive. We lack a consistent global account of how often landfalls are preceded by RI, in which basins and countries, and whether the conventional 30 kt threshold, chosen as a rare event in the Atlantic (Kaplan and DeMaria 2003), is equally rare elsewhere. The second is evaluative. A claim that imagery improves RI prediction is only as credible as the baseline it is compared with and the design behind the comparison. Three pitfalls recur. Forecasts from the same storm are not independent, so intervals that resample individual forecasts are too narrow. Random train–test splits let a model see the same storm or season in training and testing. Repeated tuning on test years turns a held-out score into a fitted one; pre-registration is the standard guard against this (Nosek et al. 2018).
We address both gaps with one study in two pre-registered stages. In the development stage, the western North Pacific, the most active basin, is used to fix the forecast design, test it on held-out seasons and learn from what fails. In the confirmation stage, a second plan, committed after the first stage and before any further model was fitted, applies the design to the five other active basins and adds a global description of RI before landfall. Each stage holds out the seasons 2022–2024 and opens them once.
The contributions are four.
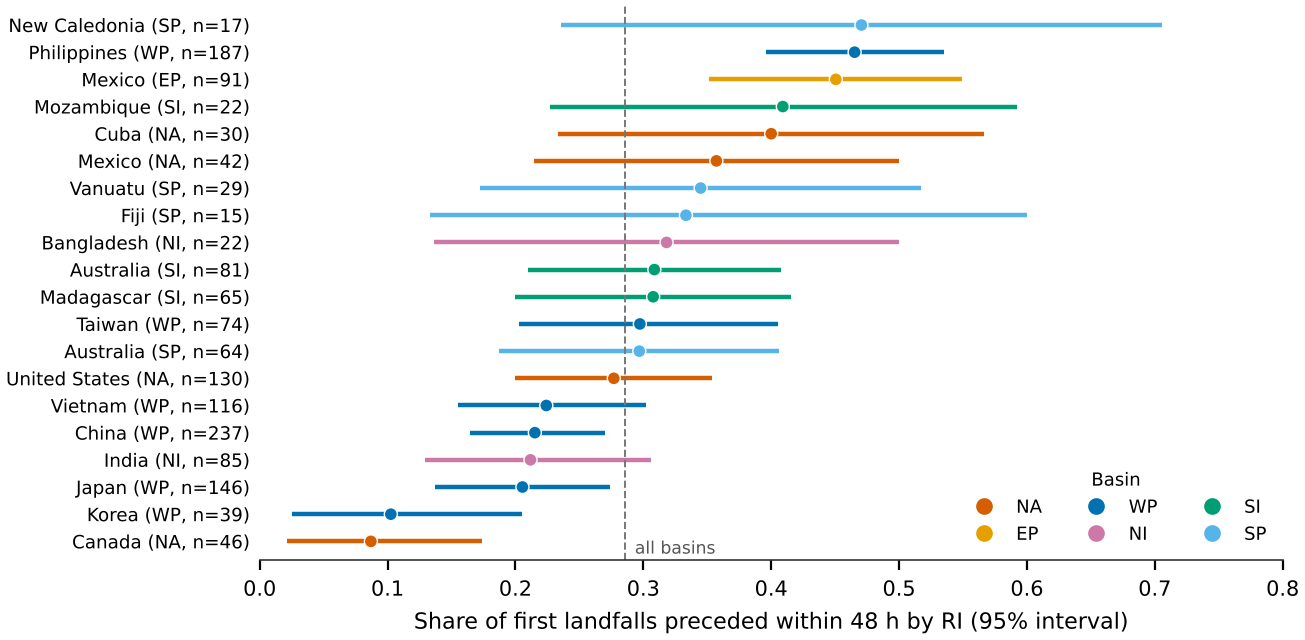
A global map of RI and landfall for 1980–2024, with one map per basin and the share of first landfalls preceded by RI for six basins and 20 country–basin pairs.
Evidence that the 30 kt threshold is rarest in the North Atlantic and less extreme in every other basin.
A pre-registered, storm-clustered evaluation of best-track-only RI prediction in six basins, with basin-specific and pooled models.
A transparent account of three hypotheses that failed, including a mis-specified leakage check, and of what the failures teach.
This work is one component of a wider research programme on Earth observation of tropical hazards. Other components need satellite imagery, reanalysis and night-light data that could not be reached for this study; Appendix A lists their status so that no result here is mistaken for one of theirs.
2 Data
2.0.0.1 Best track.
We use the International Best Track Archive for Climate Stewardship, version 4 (Knapp et al. 2010), in its subset of US agency records: the National Hurricane Center for the North Atlantic and eastern North Pacific and the Joint Typhoon Warning Center elsewhere (Chu et al. 2002), all with one-minute winds. The data come from the offline copy distributed with huracanpy 1.5.0 (Huracanpy 2026); we did not verify the exact IBTrACS revision against the NCEI distribution, and the file’s SHA-256 hash is recorded in the repository. At synoptic times the archive holds 127,252 fixes from 4,350 storms in 1980–2024. The North Atlantic basin code “NA” must be read as text; read naively it becomes a missing value and the basin disappears, an error caught before the confirmation-stage analysis. Minimum pressure is missing for every western North Pacific record before 2001, so it is not used as a predictor.
2.0.0.2 Sea-surface temperature.
Monthly ERSSTv5 at 2 resolution (Huang et al. 2017), 1970–2021, from the public xarray-data mirror (Hoyer and Hamman 2017), provides a 1981–2010 calendar-month climatology at the storm centre, which exists for every year including the test seasons, and a Niño-3.4 index for 1980–2021.
2.0.0.3 Geography.
Natural Earth 1:50m land polygons and admin-0 countries (Natural Earth 2026) provide the land mask, the distance to the nearest coast and the country of each landfall.
2.0.0.4 Basins.
We analyse the North Atlantic (NA), eastern North Pacific (EP), western North Pacific (WP), North Indian (NI), South-West Indian and Australian (SI) and South Pacific (SP) basins. The South Atlantic holds three storms and is not analysed. Europe has no tropical-cyclone basin; we extend the North Atlantic map to 20E to show storms that reach Europe after extratropical transition.
3 Methods
3.1 Forecast sample and outcome
A forecast is issued at a synoptic fix of storm with intensity kt, an observed intensity 24 h later, and a centre over water at , , , and h. Fixes labelled extratropical or subtropical are excluded. The outcome is with 35 and 40 kt as secondary thresholds in the development basin. The six basins yield 59,565 forecasts. The development stage computed 24-h changes only within western North Pacific fixes, so its sample (18,574 forecasts) is slightly smaller than the basin’s count in Table 3, which follows storms across basin boundaries.
3.2 Predictors
Every predictor is known at forecast time, and none identifies the year or the storm (Table 1). The climatological environment group is a weak stand-in for vertical shear, humidity and ocean heat content, which require a reanalysis that was not available. The pooled model of the confirmation stage makes the two hemispheres comparable by using absolute latitude, poleward rather than northward motion, and a seasonal phase shifted by half a year in the Southern Hemisphere, and it adds basin indicators.
Table 1. Predictors, all computed from information available at forecast time .
| Group | Predictor | Definition |
|---|---|---|
| Persistence | Current intensity | (kt); the logistic model also uses |
| 6-h and 12-h change | , (kt); missing for new storms, with an indicator | |
| Life cycle | Storm age | Hours since the storm’s first fix |
| Lifetime maximum so far | (kt), and minus this maximum | |
| Kinematics | Position | Latitude and longitude |
| Translation | Speed and its zonal and meridional components over to (km h) | |
| Climatological | SST climatology | ERSSTv5 1981–2010 mean for the calendar month at the centre (C) |
| environment | Land and season | Distance to nearest land (km); sine and cosine of day of year |
3.3 Models and calibration
M0 forecasts the basin’s training-period RI frequency. M1 is an -penalised logistic regression fitted separately in each basin, with the penalty chosen on validation Brier score from . In the development basin only, M2 is a histogram gradient-boosting classifier (Friedman 2001; Pedregosa et al. 2011) chosen from a small grid (Appendix C). MG is one logistic regression for all six basins (selected ). Each model is calibrated by an isotonic regression (Zadrozny and Elkan 2002; Niculescu-Mizil and Caruana 2005) fitted to that basin’s validation forecasts, giving M1c, M2c and MGc.
3.4 Evaluation
Seasons up to 2018 train the models, 2019–2021 validate them, and 2022–2024 test them. The primary score is the Brier skill score (Brier 1950; Wilks 2011) against M0, where is the forecast probability, the outcome and the training frequency of the forecast’s basin. Secondary scores are the precision–recall area, which suits rare events (Saito and Rehmsmeier 2015), the ROC area and reliability diagrams. Intervals come from 2,000 bootstrap resamples of whole storms (Efron and Tibshirani 1993), with model differences computed on the same resamples.
3.5 Two-stage pre-registration
The development-stage plan was committed to version control before any model was fitted and amended once, also before fitting, to drop the era-dependent pressure predictor. Its test seasons were opened once. The confirmation-stage plan was committed after the development results were known and before any further model was fitted. It carried forward two lessons from the development stage: boosting was dropped, and the leakage check was replaced by the corrected null described in Section 4.5. Its test seasons, for the five new basins, were opened once at 2026-11-14 04:54:00 UTC. Western North Pacific results in the confirmation stage are therefore not confirmatory. Table 2 lists the seven hypotheses and their outcomes; analyses added after a stage’s test seasons were opened are labelled exploratory.
Table 2. Pre-registered hypotheses and outcomes. The plan label refers to the repository files ANALYSIS_PLAN.md (B) and ANALYSIS_PLAN_GLOBAL.md (G).
| Plan | Hypothesis | Outcome | |
|---|---|---|---|
| Development stage: western North Pacific | |||
| H1 | B1 | M1c and M2c have test BSS above zero | Supported |
| H2 | B2 | Boosting (M2c) beats logistic regression (M1c) | Not supported |
| H3 | B3 | With labels swapped between storms, M2’s test BSS is at most zero | Not supported |
| Confirmation stage: five new basins and global description | |||
| H4 | G1 | In each of NA, EP, NI, SI and SP, M1c has test BSS above zero | EP and SI only |
| H5 | G2 | The pooled model MGc beats M1c on the five new basins | Not supported |
| H6 | G3 | In the NA, 30 kt lies between the 93rd and 97th percentile of the 24-h change | Supported |
| H7 | G4 | The share of first landfalls preceded by RI differs across basins | Supported |
3.6 Landfalls and the RI precursor
Positions and intensities are interpolated hourly between consecutive 6-h fixes. A landfall occurs at the first hour at which the centre moves from water to land with an intensity of at least 35 kt; its basin is that of the preceding fix and its country the Natural Earth unit containing the point (Hong Kong and Macao are merged with China, and the two Koreas into Korea). We keep each storm’s first landfall in each country and count landfalls at any stage of the storm, including after extratropical transition. A landfall at time is preceded by RI when a 24-h gain of at least 30 kt between synoptic fixes ends within . This precursor is a proxy for forecast surprise; the operational forecast archives needed to measure surprise directly were not available. Countries with at least 15 first landfalls in a basin are reported individually.
3.7 ENSO
For the western North Pacific, a Niño-3.4 index is computed from ERSSTv5 as the area-weighted mean over 5S–5N, 170W–120W, with anomalies relative to 1981–2010. Each season is described by its July–October mean and classed as El Niño (C), La Niña (C) or neutral, giving 9, 12 and 21 seasons in 1980–2021. Formation is the first fix at 35 kt or more, and correlations use permutation tests.
4 Results
4.1 A global picture
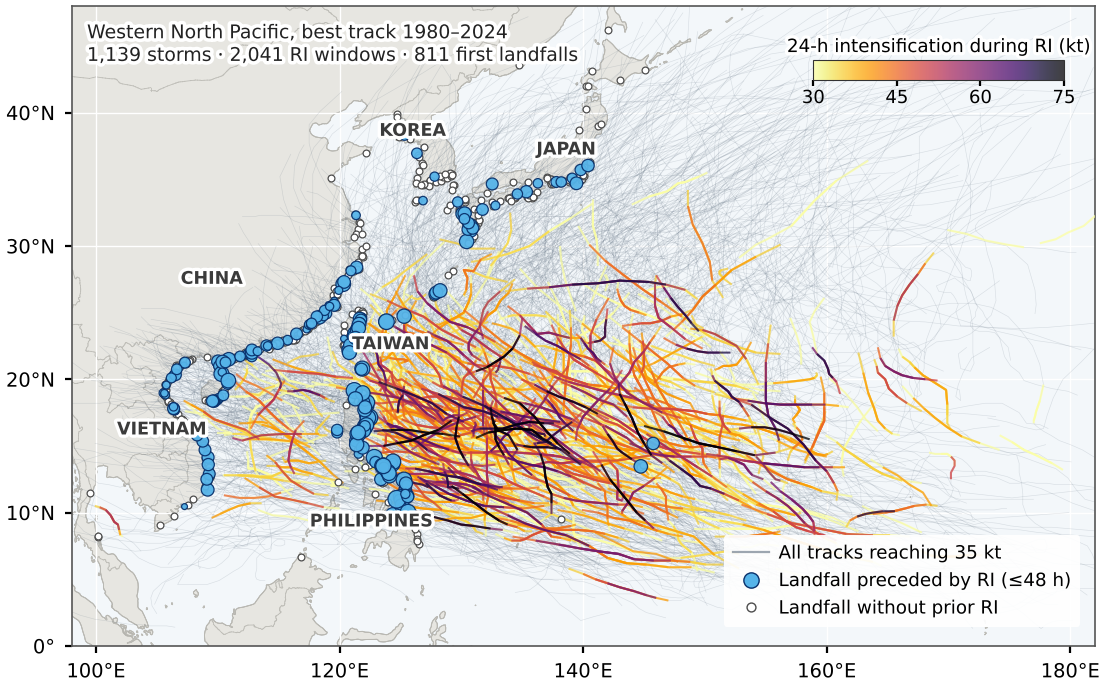
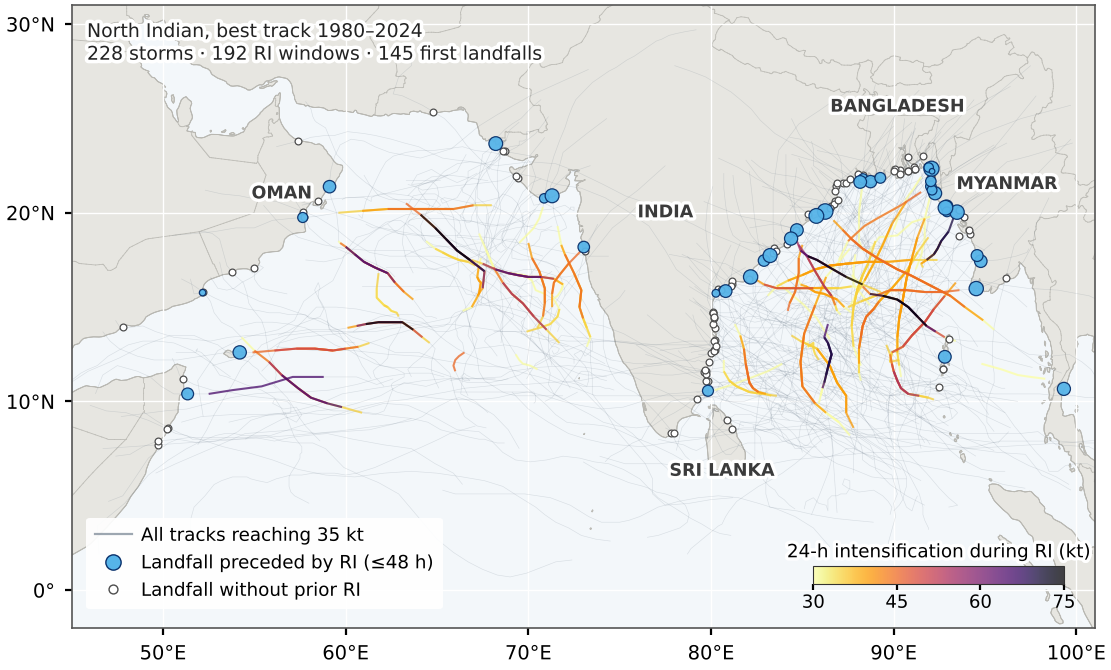
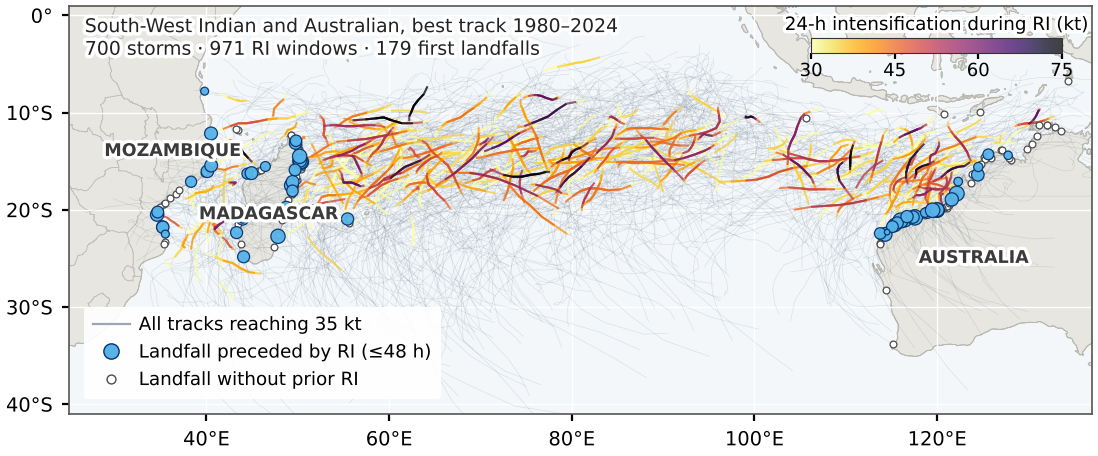
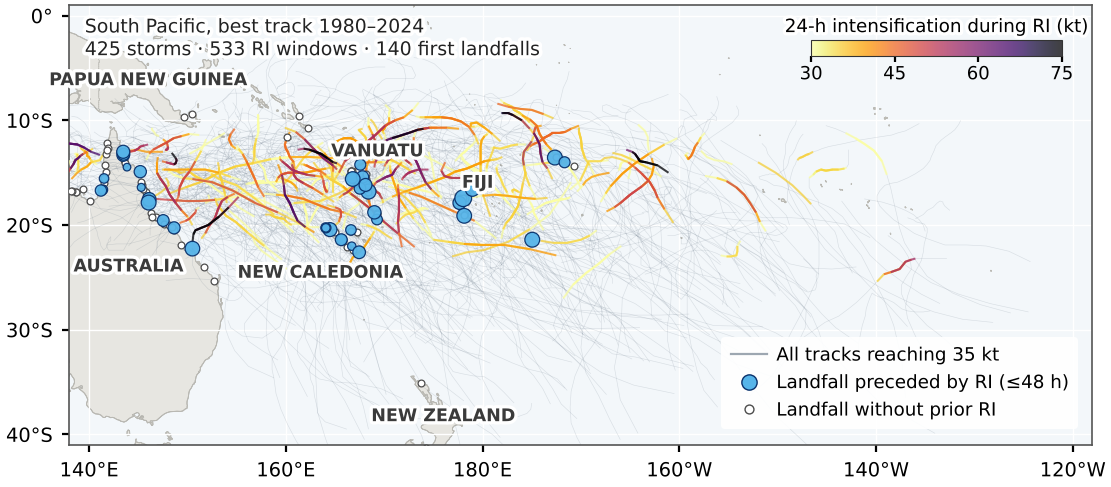
Figure 1 shows all 3,887 tracks that reached 35 kt, every over-water RI window and every first landfall. RI occurs over warm tropical oceans, mostly between about 5 and 30 of latitude in both hemispheres, with the densest clusters in the western North Pacific and off south-western Mexico. Table 3 summarises the six basins.
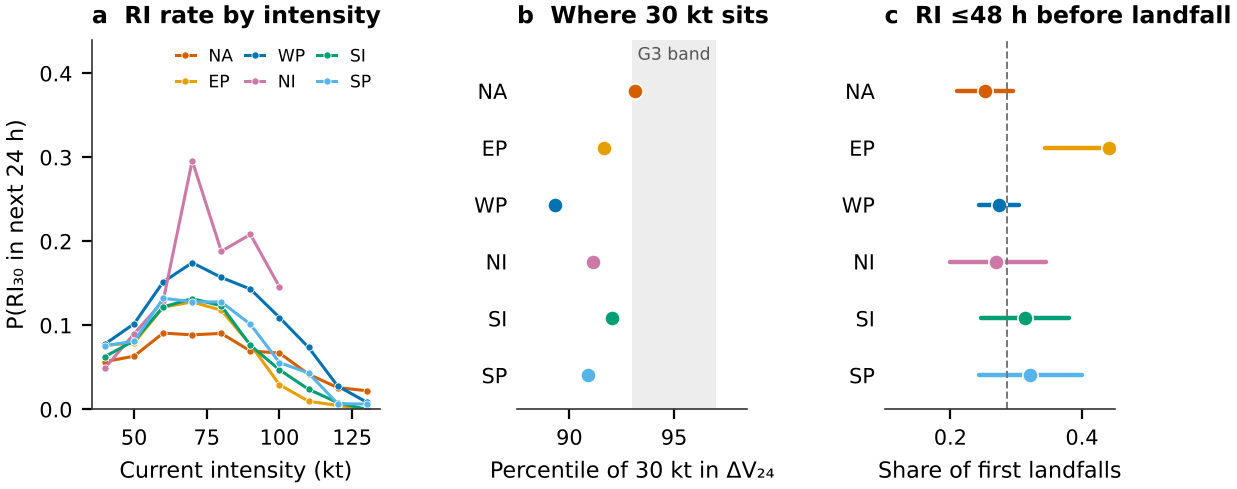
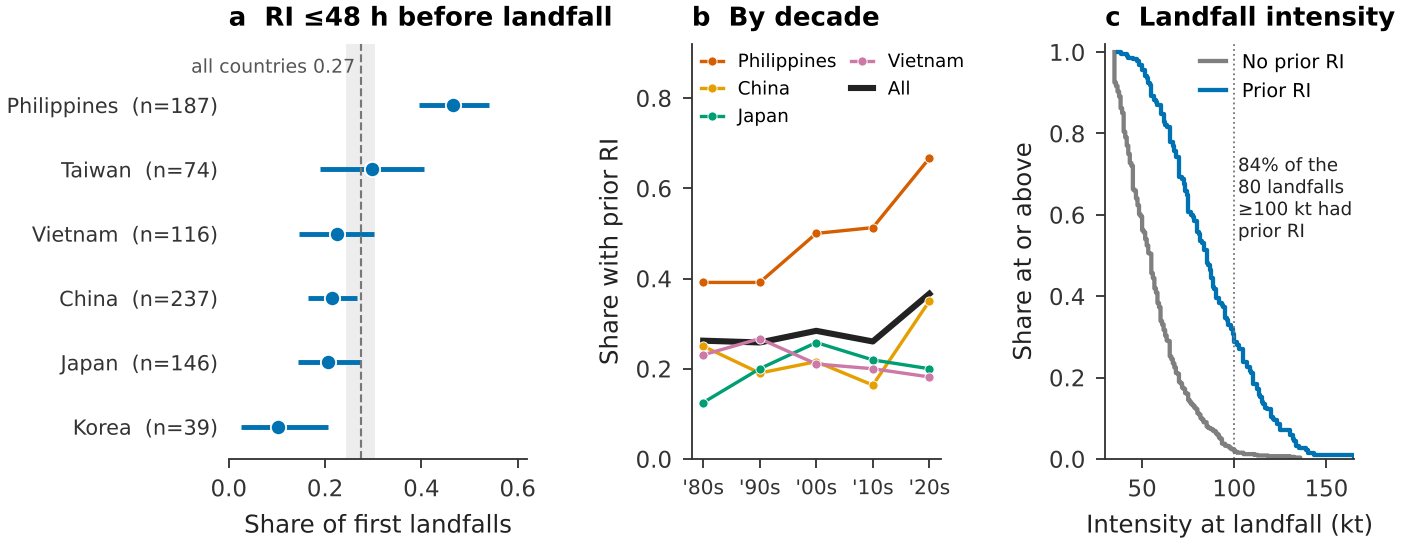
The 30 kt threshold is not equally rare everywhere. In the North Atlantic training sample it lies at the 93.1 percentile of the 24-h change, inside the pre-registered band of 93–97 (H6 supported, at the band’s lower edge), consistent with its original choice as roughly the 95th percentile of an Atlantic sample (Kaplan and DeMaria 2003). Everywhere else it is less extreme: 89.3 in the western North Pacific and between 90.9 and 92.0 in the other basins (Fig. 2b). A fixed 30 kt definition thus selects a larger share of forecasts outside the Atlantic. In every basin, RI probability peaks at moderate intensity and falls steeply above about 100 kt (Fig. 2a).
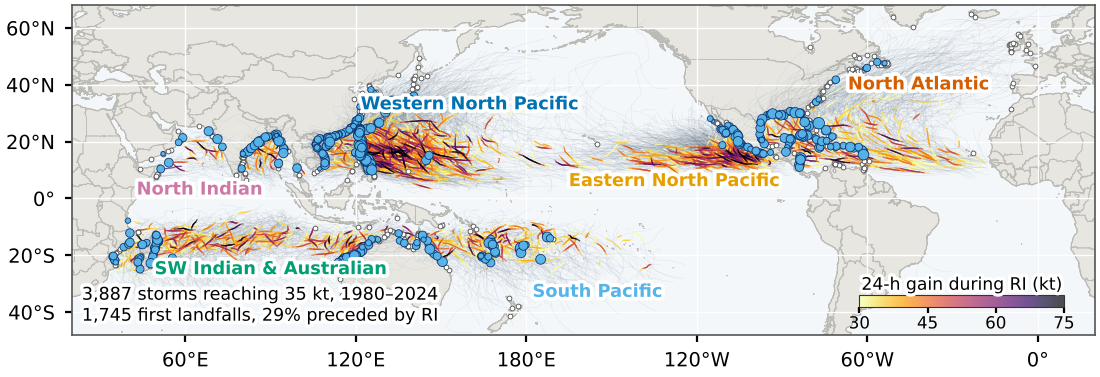
Table 3. Basin summary. Storms are those whose first fix at 35 kt lies in the basin. The percentile is that of 30 kt in the distribution of 24-h changes in the training seasons. The RI rate is the training-season share of forecasts followed by RI. The landfall share has a 95% bootstrap interval. The last two columns give the number of first landfalls at 100 kt or more and the share of them preceded by RI.
| Basin | Storms | Forecasts | Pctl. of 30 kt | RI rate | First landfalls | Share with prior RI | 100 kt | With RI |
|---|---|---|---|---|---|---|---|---|
| NA | 617 | 9,114 | 93.1 | 0.069 | 377 | 0.25 (0.21–0.29) | 42 | 0.69 |
| EP | 775 | 12,715 | 91.6 | 0.084 | 93 | 0.44 (0.34–0.54) | 8 | 0.88 |
| WP | 1,139 | 18,606 | 89.3 | 0.107 | 811 | 0.27 (0.24–0.30) | 80 | 0.84 |
| NI | 228 | 1,825 | 91.1 | 0.089 | 145 | 0.27 (0.20–0.34) | 16 | 0.88 |
| SI | 700 | 11,577 | 92.0 | 0.080 | 179 | 0.31 (0.25–0.38) | 21 | 0.81 |
| SP | 425 | 5,728 | 90.9 | 0.091 | 140 | 0.32 (0.24–0.40) | 14 | 0.93 |
4.2 Basin by basin
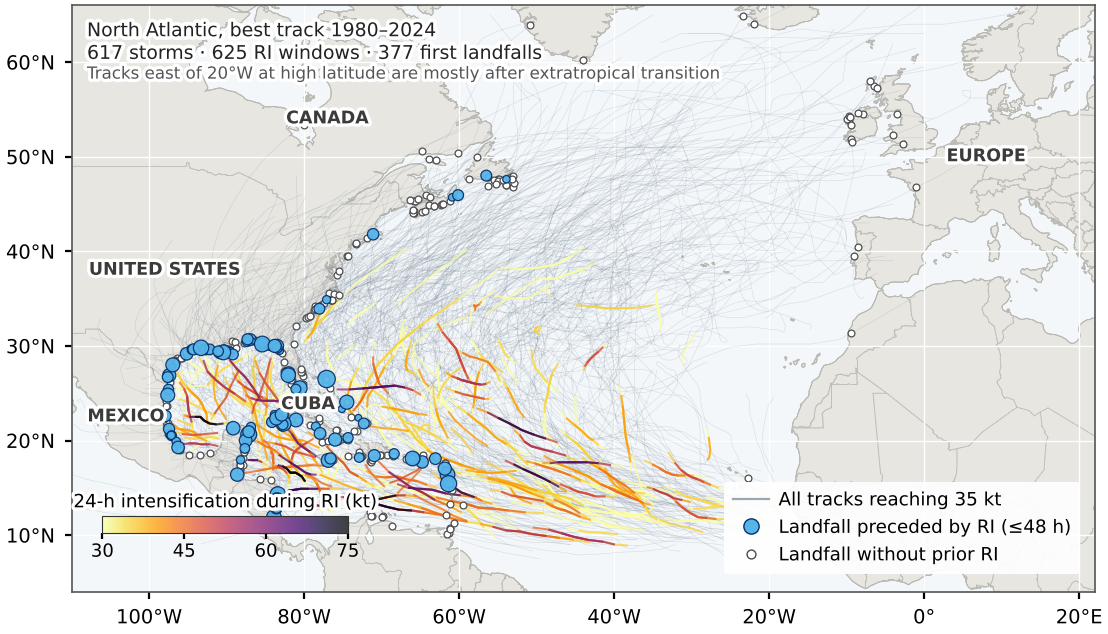
4.2.0.1 North Atlantic (Fig. 3).
RI windows extend from the tropical Atlantic east of the Caribbean through the Caribbean and the Gulf of Mexico to the western Atlantic south of about 35N. Of 377 first landfalls, 25% had an RI precursor, the lowest basin share. Many tracks recurve towards Europe, but they arrive after extratropical transition, and every landfall on a European coast in Fig. 3 appears without a precursor.
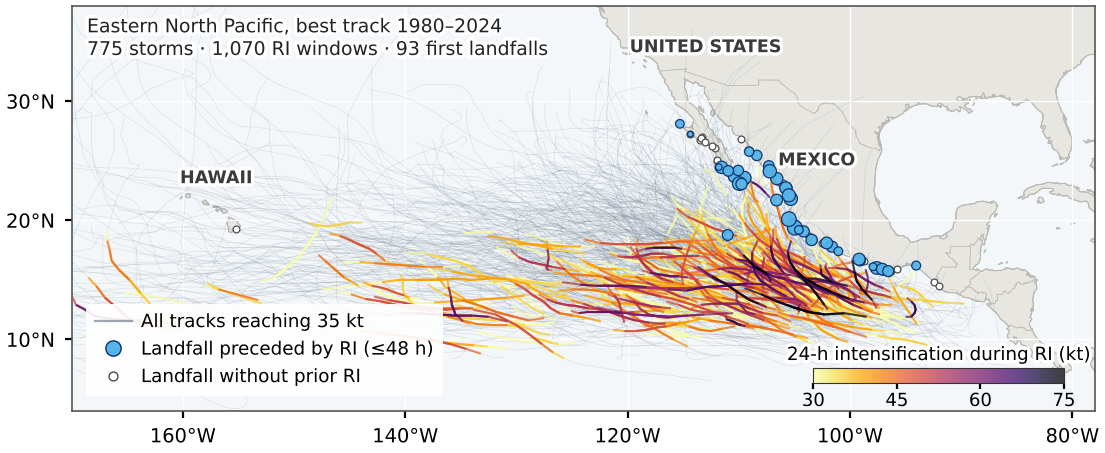
4.2.0.2 Eastern North Pacific (Fig. 4).
RI is densest in a compact band off south-western Mexico, between about 10 and 20N. Few storms make landfall, but those that do mostly strike Mexico, and 44% of the 93 first landfalls followed RI, the highest basin share.
4.2.0.3 Western North Pacific (Fig. 5).
The most active basin, with 1,139 storms. RI windows fill the region upstream of the Philippines and Taiwan.
4.2.0.4 North Indian (Fig. 6).
RI occurs mainly in the Bay of Bengal and less often in the Arabian Sea. The basin is small, 228 storms, but its RI rate at moderate intensity is the highest of any basin (Fig. 2a), with wide uncertainty.
4.2.0.5 South-West Indian and Australian (Fig. 7).
RI spans a broad band between about 10 and 20S from east of Madagascar to north-west Australia.
4.2.0.6 South Pacific (Fig. 8).
RI is concentrated between about 155E and 190E, directly in the path of island states.
4.3 Who is exposed: landfalls preceded by RI
The share of first landfalls preceded by RI differs across basins (, 5 degrees of freedom, , ; H7 supported), from 25% in the North Atlantic to 44% in the eastern North Pacific (Fig. 2c). Among the 20 country–basin pairs with at least 15 first landfalls (Fig. 9), New Caledonia, the Philippines, Mexico’s Pacific coast and Mozambique exceed 40%. Korea and Canada, both reached mostly by storms moving poleward over cooler water, are near 10%. Across all basins, 81% of the 181 landfalls at 100 kt or more followed RI. This partly reflects the fact that very intense storms nearly always pass through RI (Lee et al. 2016), but it also means that the most damaging landfalls are usually those whose intensity changed fastest just beforehand.
The development basin shows the pattern in detail (Fig. 10). Using the six country groups of the development stage, which pool small territories and so count two fewer landfalls, 47% of first Philippine landfalls followed RI (interval 0.40–0.54), against about 0.2 for China, Vietnam and Japan and 0.10 for Korea. Storms with a precursor were much stronger at landfall, with a median of 85 kt against 55 kt. The Philippine share rose over the period (odds ratio 1.27 per decade, 1.01–1.60; ), but the trend does not survive correction across the six groups (Benjamini and Hochberg 1995) (), and changes in best-track practice over 45 years limit any trend inference.
4.4 How far the best track predicts RI: the development basin
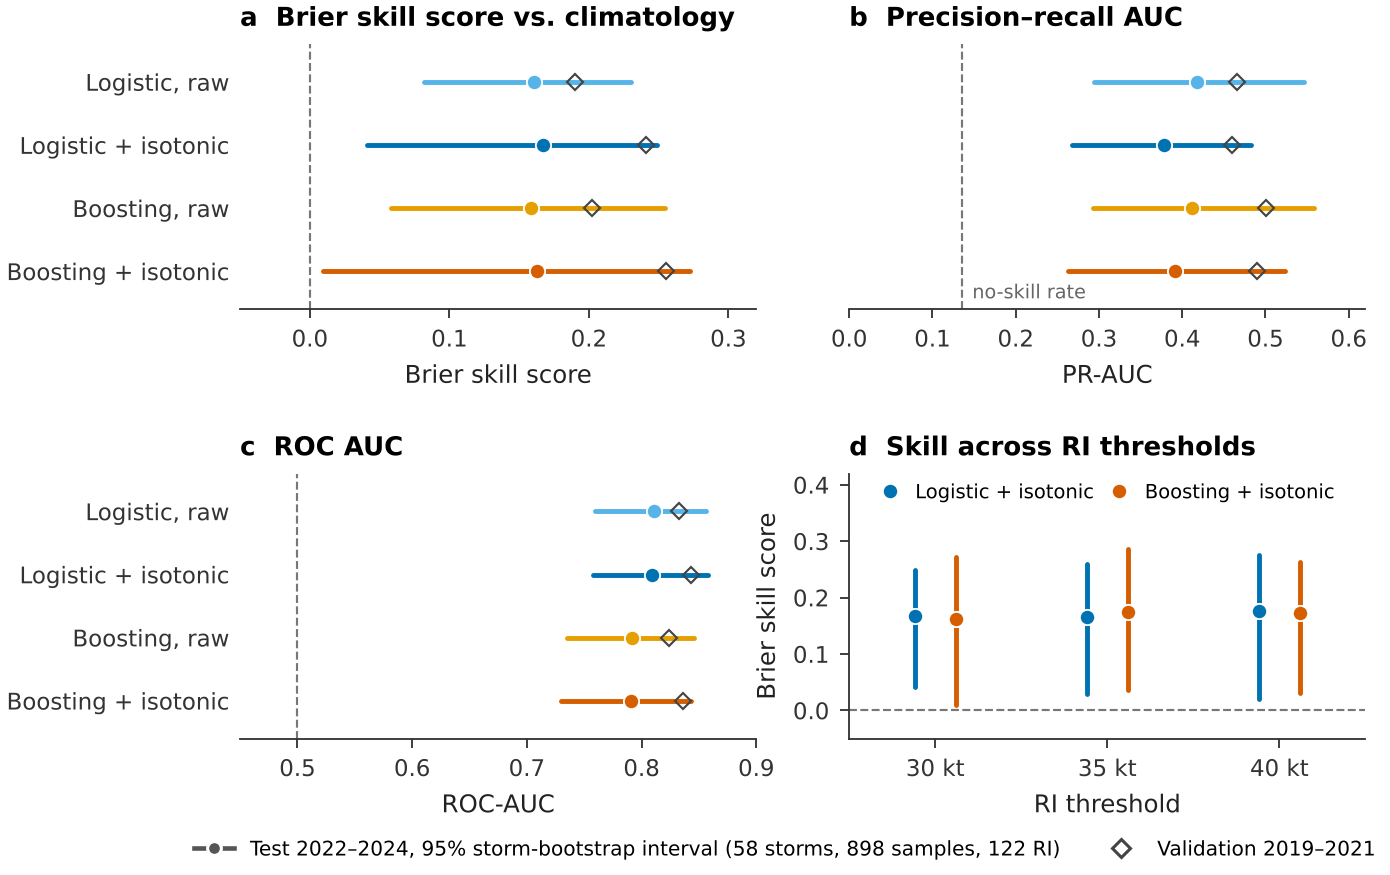
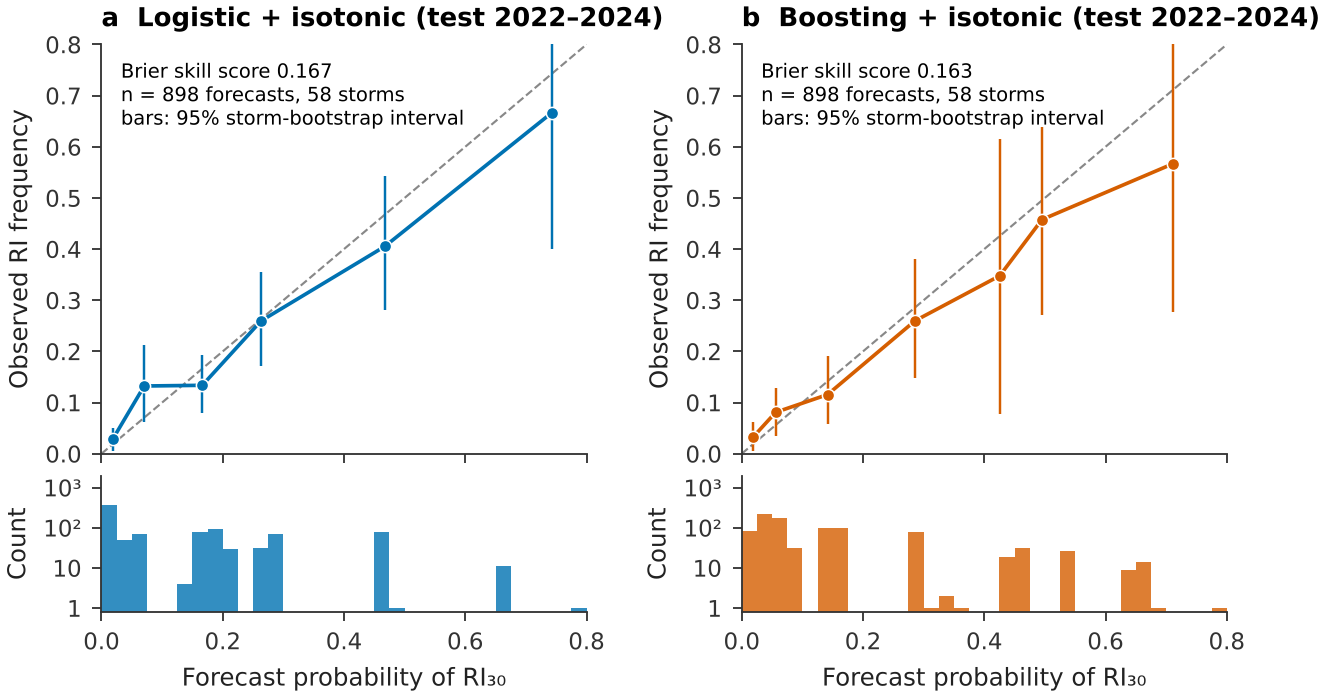
On 898 forecasts from 58 test storms in the western North Pacific (122 RI cases), both calibrated models beat climatology (Table 4, Fig. 11). M1c reached BSS 0.167 (0.041–0.249) and M2c 0.163 (0.009–0.272), so H1 is supported, although M2c’s interval comes close to zero. ROC areas near 0.8 and precision–recall areas near 0.4, against a no-skill value of 0.136, tell the same story. H2 is not supported: M2c minus M1c is 0.004 (0.088 to 0.072). With 58 test storms, a real difference smaller than about 0.08 in BSS could not be detected, so this is an absence of evidence rather than evidence of equality. Skill was similar at 35 kt (M1c 0.167 (0.029–0.260)) and 40 kt (0.176 (0.020–0.275)), and fell from validation to test for every model, as expected when selection and calibration use the validation seasons.
The calibrated forecasts are reliable within sampling error (Fig. 12). M1c follows the diagonal where forecasts are frequent; M2c slightly over-forecasts at its highest probabilities, where few forecasts and storms make the intervals wide.
Table 4. Development-basin test scores, western North Pacific 2022–2024 (898 forecasts, 58 storms, 122 RI cases). Brackets are 95% storm-bootstrap intervals. POD, FAR and CSI use the validation threshold that maximised CSI.
| Model | Brier | BSS | PR-AUC | ROC-AUC | POD | FAR | CSI | |||
|---|---|---|---|---|---|---|---|---|---|---|
| M0 climatology | 0.118 | 0 | (reference) | – | – | – | – | – | ||
| M1 logistic, raw | 0.099 | 0.161 | (0.082–0.230) | 0.417 | (0.295–0.547) | 0.811 | (0.759–0.856) | – | – | – |
| M1c logistic + isotonic | 0.099 | 0.167 | (0.041–0.249) | 0.379 | (0.268–0.482) | 0.809 | (0.757–0.858) | 0.61 | 0.62 | 0.30 |
| M2 boosting, raw | 0.100 | 0.159 | (0.058–0.255) | 0.412 | (0.293–0.559) | 0.791 | (0.735–0.846) | – | – | – |
| M2c boosting + isotonic | 0.099 | 0.163 | (0.009–0.272) | 0.391 | (0.262–0.523) | 0.791 | (0.730–0.843) | 0.59 | 0.62 | 0.30 |
4.5 A failed check, and what lies behind the skill
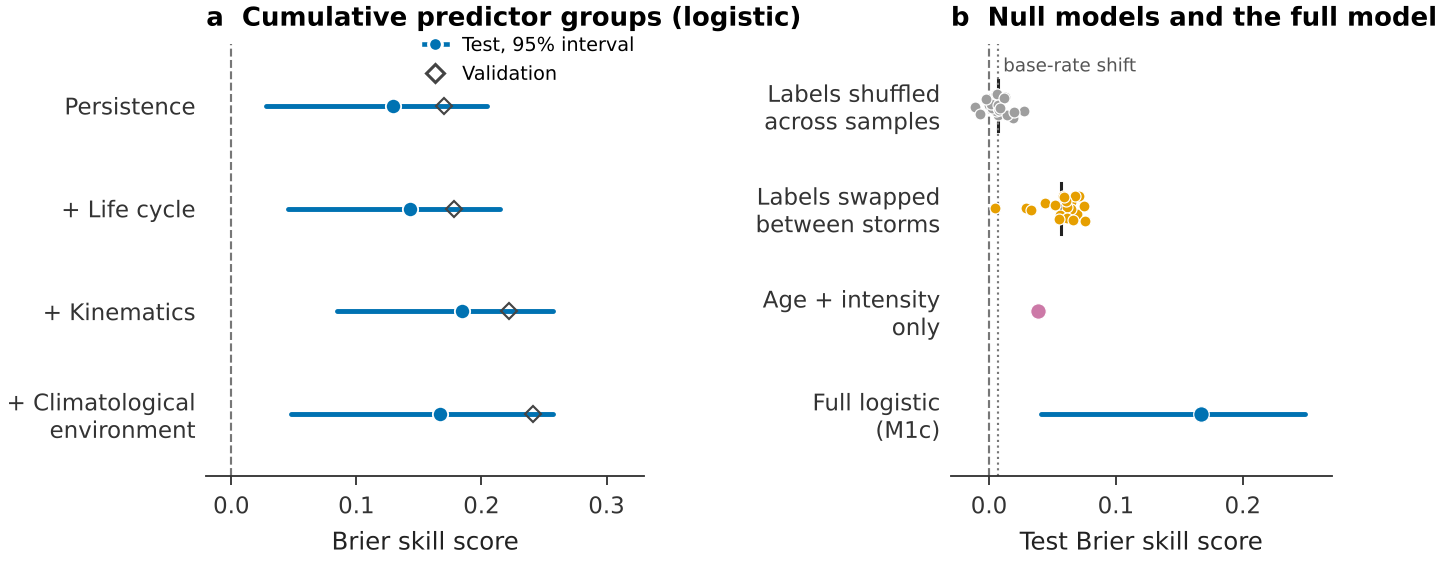
H3 failed as specified. With training labels swapped between storms, M2’s calibrated test BSS averaged 0.056 over 20 permutations (range 0.005–0.076), not zero or below. The analyses in this subsection are exploratory. The swap gave each training forecast the label at the same position in another storm’s sequence, which keeps the link between a storm’s age and its chance of RI. A model using only age and current intensity reached 0.039 on the test seasons. Shuffling labels across all training forecasts, which removes that structure, gave a mean of 0.007, equal to the BSS of a constant forecast at the test-period RI frequency (0.007): RI was more common in 2022–2024 (0.136) than in the training seasons (0.107). The check was therefore mis-specified rather than evidence of leakage (Fig. 13b). The confirmation stage adopted the full shuffle as its null.
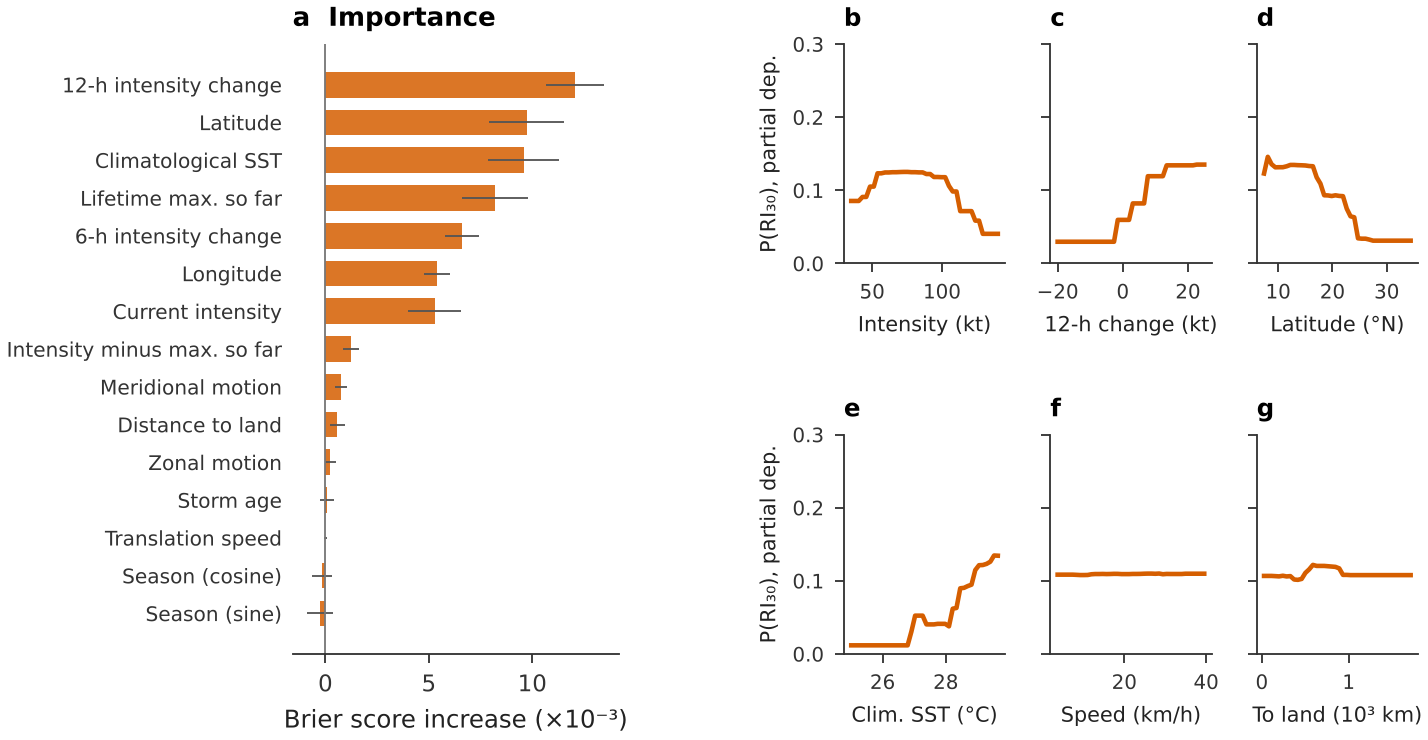
Adding predictor groups in sequence shows where the skill comes from (Fig. 13a). Persistence alone gave a test BSS of 0.129 (0.028–0.205); life-cycle predictors raised it to 0.143 and kinematics to 0.184. The climatological environment raised validation skill but changed test skill to 0.167, largely re-encoding where the storm is. On the validation seasons the three predictors whose permutation most degraded M2 were 12-h intensity change, Latitude and Climatological SST (Fig. 14). RI probability peaks at moderate intensity, rises with recent intensification, falls between about 17N and 25N and rises steeply above a climatological SST of about 28C.
4.6 Does the skill travel? The confirmation basins
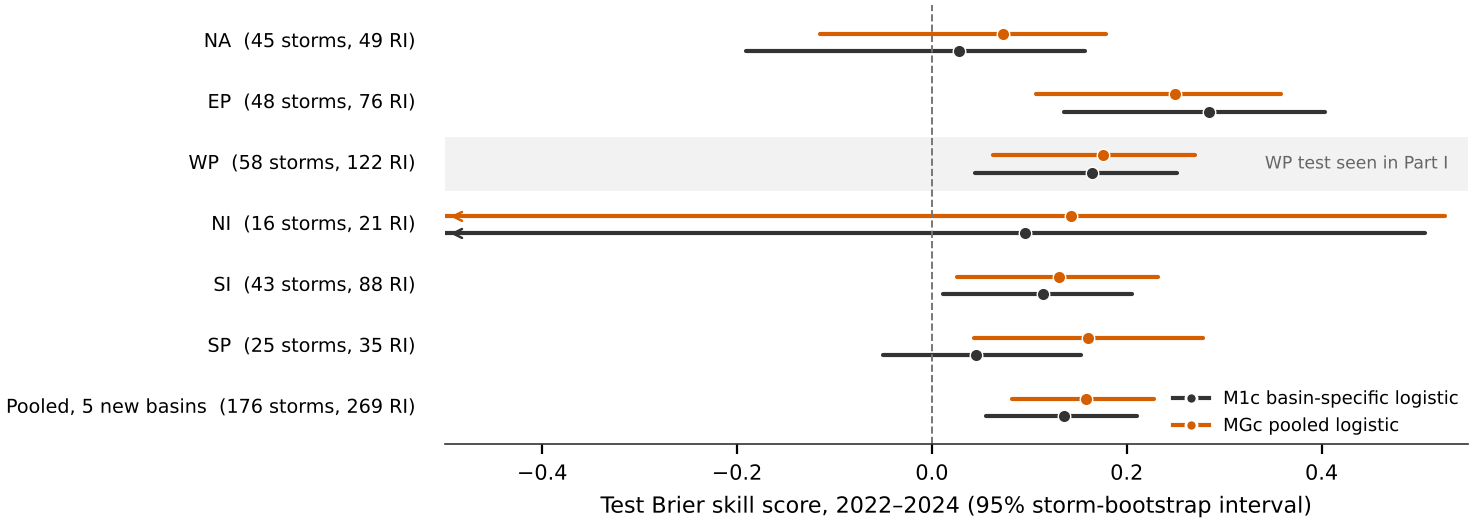
H4 is supported in two of five basins (Table 5, Fig. 15). Basin-specific models beat climatology in the eastern North Pacific (BSS 0.285, interval 0.136 to 0.404; ) and the South-West Indian and Australian basin (0.114, 0.012 to 0.205; ). They did not detectably do so in the North Atlantic (0.028, 0.191 to 0.157), the South Pacific (0.045, 0.051 to 0.153) or the North Indian Ocean, where 16 test storms make the interval uninformative. Refitted in the confirmation stage, the western North Pacific model scored 0.165, close to the development-stage value.
H5 is not supported. On the 176 test storms of the five new basins, the pooled model reached 0.158 (0.082 to 0.228) against 0.136 (0.056 to 0.211) for basin-specific models; the difference of 0.022 has an interval of 0.012 to 0.055. The point estimates favour pooling in four of five new basins, most clearly in the South Pacific (MGc 0.160, 0.043 to 0.278), but the evidence is not decisive. With labels shuffled across all pooled training forecasts, the pooled model scored 0.005, close to the 0.009 that a change in base rate alone would give.
Table 5. Confirmation-stage test scores, seasons 2022–2024. Brackets are 95% storm-bootstrap intervals; is the Benjamini–Hochberg adjusted bootstrap for H4. ROC is the ROC area of M1c. Western North Pacific test seasons were seen in the development stage and are not confirmatory.
| Basin | Forecasts | Storms | RI | M1c BSS | MGc BSS | ROC | |
|---|---|---|---|---|---|---|---|
| NA | 776 | 45 | 49 | 0.028 (0.191 to 0.157) | 0.422 | 0.073 (0.115 to 0.179) | 0.79 |
| EP | 763 | 48 | 76 | 0.285 (0.136 to 0.404) | 0.003 | 0.249 (0.107 to 0.358) | 0.88 |
| WP | 898 | 58 | 122 | 0.165 (0.044 to 0.251) | – | 0.175 (0.063 to 0.270) | 0.81 |
| NI | 135 | 16 | 21 | 0.096 (1.166 to 0.506) | 0.422 | 0.143 (1.095 to 0.527) | 0.77 |
| SI | 801 | 43 | 88 | 0.114 (0.012 to 0.205) | 0.039 | 0.130 (0.025 to 0.232) | 0.82 |
| SP | 254 | 25 | 35 | 0.045 (0.051 to 0.153) | 0.373 | 0.160 (0.043 to 0.278) | 0.85 |
| Pooled, five new | 2,729 | 176 | 269 | 0.136 (0.056 to 0.211) | – | 0.158 (0.082 to 0.228) | – |
4.7 ENSO in the western North Pacific
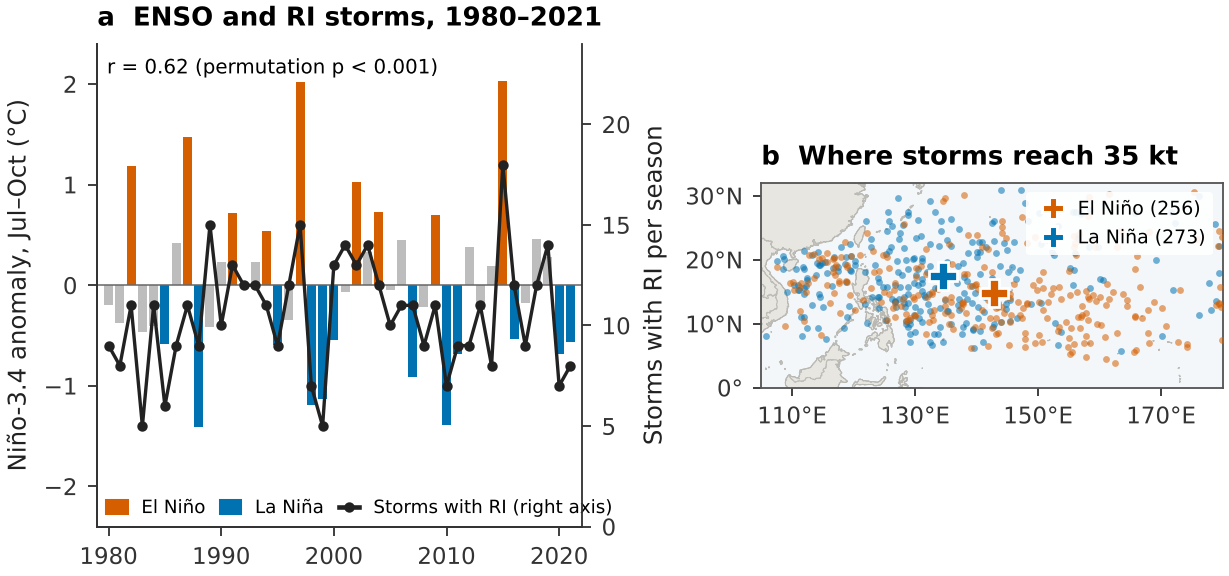
The seasonal number of storms that underwent RI tracked the July–October Niño-3.4 anomaly (, permutation ; Fig. 16a). Much of this comes from where storms form: El Niño formation lay 8.4 farther east than La Niña formation (interval 5.4–11.3; 256 and 273 storms), reproducing Wang and Chan (2002). The share of storms that underwent RI was higher in El Niño seasons (0.45) than in La Niña seasons (0.38), but the difference is uncertain (0.01 to 0.15). Storms forming farther east spend longer over warm water, consistent with the link between ENSO and intensity reported by Camargo and Sobel (2005). In an exploratory analysis, whether a landfall followed RI showed no clear relation to the index (odds ratio 0.86 per C, 0.69–1.08).
5 Discussion
5.0.0.1 Where landfall surprise concentrates.
RI before landfall is common wherever a coast faces open warm water near the latitudes of peak RI: Mexico’s Pacific coast, the Philippines and the islands of the south-west Pacific. It is rare where storms arrive after moving poleward over cooler water, as in Korea and Canada, and absent from Europe, which storms reach only after extratropical transition. For warning services in the most exposed countries, an intensity forecast issued two days before landfall is, in a third to a half of cases, a forecast for a storm about to change quickly.
5.0.0.2 What the best track carries, and why it differs between basins.
Best-track persistence and position carry real RI information: a BSS near 0.17 in the western North Pacific, 0.285 in the eastern North Pacific and 0.114 in the South-West Indian and Australian basin. The eastern North Pacific may score highest because its RI is confined to a compact region that position and season capture. In the North Atlantic, RI may depend more on environmental conditions such as vertical wind shear, which the best track does not contain, and the test seasons held only 49 RI cases. These explanations are hypotheses; testing them requires the reanalysis predictors that were unavailable here.
5.0.0.3 What staged pre-registration taught.
Of seven hypotheses, three were supported, one was supported in two of five basins, and three were not. The development stage was worth having: it showed that boosting added nothing and exposed a mis-specified leakage check, and both lessons were written into the confirmation plan before its models were fitted. Reporting the failures, rather than redefining the checks after the fact, is what makes the supported results credible.
5.0.0.4 Implications for image-based models.
A model that adds satellite imagery or reanalysis should be compared with a calibrated logistic baseline of this kind, basin by basin, on whole held-out seasons, with storm-clustered intervals. Three test seasons cannot resolve gains smaller than about 0.08 in BSS; rolling-origin evaluation over more seasons, or pooling across basins, will be needed to detect the modest gains that are realistic.
5.0.0.5 Limitations.
Best-track intensity methods differ between agencies and changed over 1980–2024, and the copy used here was not checked against the NCEI master file.
The climatological SST is not the SST each storm experienced, and no shear, humidity or ocean heat content was available, so the environmental contribution measured here is a lower bound.
Test seasons hold few storms in some basins (16 in the North Indian Ocean), so intervals are wide and model comparisons are underpowered.
The RI precursor is a proxy for forecast surprise; operational forecast archives are needed to measure surprise directly.
Landfalls are counted at any stage, including after extratropical transition, on a 1:50m coastline that misses small islands.
The Niño-3.4 index uses a fixed 1981–2010 base, differs from the operational Oceanic Niño Index and ends in 2021.
6 Conclusion
Since 1980, more than a quarter of first landfalls worldwide followed RI within two days, and four in five landfalls at 100 kt or more did. Exposure is highest where coasts face open warm water near the latitudes of peak RI, led by Mexico’s Pacific coast, the Philippines and the south-west Pacific islands. The 30 kt threshold is rarest in the Atlantic, where it was defined. Under a two-stage pre-registered design, the best track alone supports calibrated RI forecasts in some basins and not yet detectable skill in others. These basin-specific baselines are the bar that models using satellite imagery or reanalysis must clear.
Data and code availability
All inputs are public: IBTrACS version 4 as packaged in huracanpy 1.5.0, ERSSTv5 and Natural Earth. The repository contains both pre-registered plans with their commit history, every script, the derived tables, the automatic text-overlap report for every figure, and the scripts that write every number in this paper from the result files.
Use of AI assistance
Data acquisition, analysis code, figures and the text of this paper were produced with the assistance of Claude (Anthropic), an AI system, working under the author’s direction. The author reviewed the work and is responsible for its content. Reference entries were compiled without access to a bibliographic search service and should be checked against the original sources.
References
Appendix A: Scope within the research programme
Table 6. Status of the research programme’s components. “Not executed” means the required data could not be reached from the computing environment used here; no substitute or synthetic data were used.
| Component | Data required | Status |
|---|---|---|
| RI prediction from best-track and climatological predictors; landfall atlas | IBTrACS, ERSSTv5, Natural Earth | This paper |
| RI prediction with satellite-image and reanalysis predictors | Himawari-8/9, Digital Typhoon, ERA5 | Not executed |
| Power outages and recovery after landfall | Black Marble VNP46A2 (Román et al. 2019), GPM IMERG, forecast archives | Not executed |
| Earth as a single pixel | DSCOVR/EPIC L1B and L2 | Not executed |
| Transboundary haze attribution | NASA FIRMS, ERA5, PM2.5 networks, Himawari AOD | Not executed |
| Resolution ladder across components | Outputs of the components above | Not executed |
Appendix B: Deviations and timeline
Development stage. Plan committed before fitting; amendment v1.1, also before fitting, dropped minimum pressure (missing before 2001) and excluded extratropical and subtropical fixes; model code committed; test seasons opened once, on 14 November 2026 at 03:31:13 UTC.
Partial dependence. First computed with the tree-recursion method, which returns log-odds; recomputed with the brute-force method on a refit of the selected boosting model from training data only.
H3. The permutation scheme was mis-specified, as described in Section 4.5. The pre-registered result is reported as failed; the full-shuffle null, the age-and-intensity model, the predictor-group sequence, permutation importance, partial dependence and the relation between landfall precursors and ENSO are exploratory.
Confirmation stage. Plan committed after the development results and before any further model was fitted; preparation, model and descriptive code committed before the new-basin test seasons were opened at 2026-11-14 04:54:00 UTC. The basin code “NA” was found to be read as missing by default and was corrected before the plan was written; the development stage, which used only the western North Pacific, was not affected.
Display choices. The North Atlantic map extends to 20E to show Europe; this changes no analysis.
Appendix C: Model selection in the development basin
Table 7. Validation Brier score (2019–2021) for each candidate configuration in the western North Pacific. The lowest score in each model family was selected.
| Model | Configuration | Validation Brier |
|---|---|---|
| M1 | 0.1058 | |
| M1 | 0.1004 | |
| M1 | 0.0981 | |
| M1 | 0.0978 | |
| M2 | learning rate 0.03, 15 leaves, 150 iterations | 0.0964 |
| M2 | learning rate 0.03, 15 leaves, 400 iterations | 0.0974 |
| M2 | learning rate 0.03, 31 leaves, 150 iterations | 0.0975 |
| M2 | learning rate 0.03, 31 leaves, 400 iterations | 0.0998 |
| M2 | learning rate 0.1, 15 leaves, 150 iterations | 0.0985 |
| M2 | learning rate 0.1, 15 leaves, 400 iterations | 0.1013 |
| M2 | learning rate 0.1, 31 leaves, 150 iterations | 0.1003 |
| M2 | learning rate 0.1, 31 leaves, 400 iterations | 0.1040 |