1 Introduction
When a large firm or business group collapses, the post-mortem almost always finds warnings that were “hiding in plain sight”: a short-seller report, a delayed audit, a controlling shareholder pledging shares, a supplier complaining about late payment, a sudden exodus of managers. The narrative has an obvious policy corollary. If the signs were there, then investors, lenders and supervisors could have acted on them, and a sufficiently rich stream of alternative data—information beyond audited statements and market prices—should let them do so next time.
This paper takes the corollary seriously and asks a sharper question: of the predictability that is visible in hindsight, how much was available as foresight? The distinction matters because retrospective analysis is structurally biased towards finding signals. The analyst knows which firms failed and when; chooses which data to inspect after the event; judges signals against the outcome rather than against the thousands of healthy firms that showed the same pattern; and lines up time series on the failure date, which produces smooth pre-event trends almost by construction. Psychologists have documented the corresponding cognitive bias for half a century (Fischhoff 1975; Roese and Vohs 2012); statisticians describe the methodological versions as leakage, multiple testing and selection on the outcome (Kaufman et al. 2012; Gelman and Loken 2014; Harvey et al. 2016).
I organise the analysis around six research questions:
Which families of alternative data carried information about the deterioration of firms and business groups before failure became public?
How much lead time did each signal provide relative to the public revelation of distress?
Do the same families, with the opposite sign, identify genuine turnarounds?
How much of the apparent predictive power survives evaluation that respects the information set available at the time?
Which datasets are accessible, affordable and lawful in Thailand, and how should Thai supervisors use them?
Which mechanisms generate hindsight bias, and how large is each?
The paper makes four contributions. First, it provides a structured taxonomy of eleven alternative-data families with an explicit scoring rubric that includes the often ignored criterion of point-in-time integrity: whether the historical value of a series can be recovered as it was known on a given date. Second, it codes a corpus of 28 global and Thai failures and turnarounds by the first publicly documented signal in each family, so that lead times are measured from public information rather than from facts that emerged in later litigation. Third, it quantifies hindsight bias on real data. Using the public release of Bao et al. (2020), I show how successive layers of leakage inflate the measured skill of a fraud-detection model, how case–control sampling inflates precision, and how right-censoring of labels makes recent years look safe. Fourth, a set of Monte Carlo experiments isolates the mechanisms—forking paths, alignment on the outcome, timeliness versus noise, and base-rate neglect—in a setting where the truth is known.
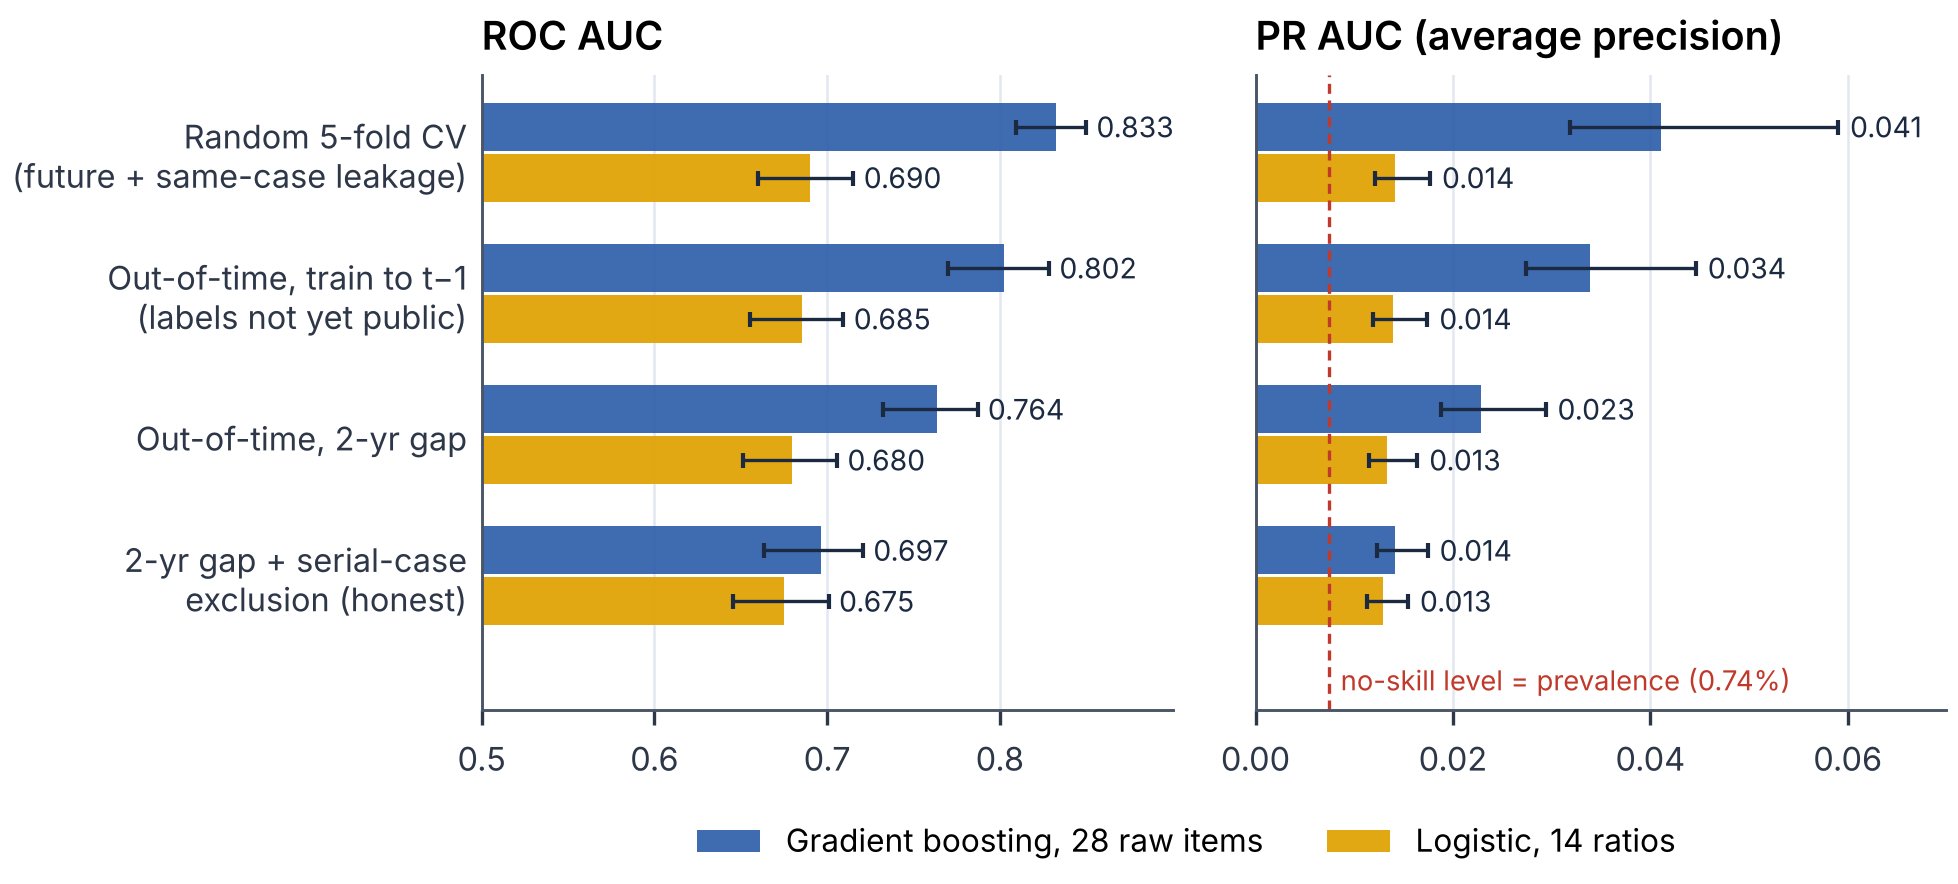
The main findings are sobering but not nihilistic. Signals did exist: all but one of the 24 failures in the corpus produced at least one public warning before revelation, and the median failure produced signals in nearly three families. But the median lead time was nine months, and only eight of 24 failures gave a public signal a year or more ahead. In the U.S. panel, about 40% of the apparent skill above chance of a flexible model disappears under honest evaluation (ROC AUC 0.833 0.697), while a simple logistic model loses little (0.690 0.675). Flexible learners are therefore the most exposed to hindsight, which is precisely the class of model that alternative-data vendors favour. At realistic base rates, a warning system with good discrimination still produces many false alarms per true alarm, so its value lies in prioritising human review rather than in automatic action.
The remainder of the paper proceeds as follows. Section 2 reviews the literature. Section 3 formalises five channels of hindsight bias. Section 4 describes the taxonomy, the case corpus, the public panel and the simulation design. Section 5 reports results. Section 6 turns to Thailand. Section 7 discusses limitations and Section 8 concludes.
2 Related literature
2.0.0.1 Distress and default prediction
Modern distress prediction begins with univariate ratio analysis (Beaver 1966) and multivariate discriminant scores (Altman 1968), followed by logit models (Ohlson 1980), structural distance-to-default measures derived from Merton (1974) and evaluated by Bharath and Shumway (2008), and discrete-time hazard models that combine accounting and market variables (Shumway 2001; Campbell et al. 2008). Duffie et al. (2007) extend prediction to multi-period horizons with stochastic covariates, and a growing literature compares machine-learning classifiers with these benchmarks (Barboza et al. 2017; Jones et al. 2017). A common thread is that market variables add information to accounting variables because they are timelier—the same logic that motivates alternative data.
2.0.0.2 Misreporting and fraud detection
A parallel literature predicts accounting manipulation from financial statements (Dechow et al. 1996, 2011; Beneish 1999) and, more recently, from text (Purda and Skillicorn 2015; Brown et al. 2020). Bao et al. (2020) show that an ensemble learner applied to 28 raw accounting items outperforms ratio-based models out of time, and they release the data used here. Their design choices—a two-year gap between training and test periods and the treatment of serial frauds—are exactly the safeguards against hindsight whose value I quantify. Work on who uncovers fraud (Dyck et al. 2010) and on the role of short sellers (Karpoff and Lou 2010) shows that many revelations originate outside the formal reporting system, which is itself an argument for monitoring alternative channels. Karpoff et al. (2008) document how large the costs of revelation are for the firm.
2.0.0.3 Alternative data in finance
Text from filings and the press predicts returns (Tetlock 2007; Loughran and McDonald 2011; Cohen et al. 2020); search volume measures attention (Da et al. 2011); crowdsourced employer reviews (Green et al. 2019) and consumer opinions (Huang 2018) carry information about fundamentals; and the arrival of new data sources such as satellite imagery can discipline managers (Zhu 2019). Share pledging by insiders has been linked to crash risk and firm value (Dou et al. 2019). Most of this literature studies return predictability in the cross-section; comparatively little evaluates alternative data as an early-warning input under the strict information constraints faced by a supervisor.
2.0.0.4 Business groups
Pyramidal, family-controlled business groups dominate East Asian corporate sectors (Claessens et al. 2000), including Thailand (Wiwattanakantang 2001). Groups can create value by substituting for missing institutions but also enable tunnelling of resources from minority shareholders (Johnson et al. 2000; Bertrand et al. 2002; Khanna and Yafeh 2007). For early warning, groups matter because distress propagates through intra-group guarantees, related-party transactions and pledged shares, so the unit of analysis must be the group rather than the listed entity. The 1997 Thai crisis, in which distress spread from property developers to finance companies and banks, illustrates the point (Radelet and Sachs 1998; Kaminsky and Reinhart 1999).
2.0.0.5 Hindsight, leakage and multiple testing
Hindsight bias was first demonstrated experimentally by Fischhoff (1975); Roese and Vohs (2012) survey the evidence. In statistical learning, Kaufman et al. (2012) formalise leakage, López de Prado (2018) discusses its forms in financial backtests, and Mullainathan and Spiess (2017) emphasise out-of-sample discipline. The “garden of forking paths” (Gelman and Loken 2014) and the multiple-testing problem in empirical finance (Harvey et al. 2016) describe how flexible analysis choices inflate apparent findings. On evaluation metrics under class imbalance, Saito and Rehmsmeier (2015) argue for precision–recall analysis and Hand (2009) criticises the AUC as a cost-blind summary. This paper brings these strands to bear on the specific claim that corporate failure was foreseeable.
3 A framework for hindsight bias
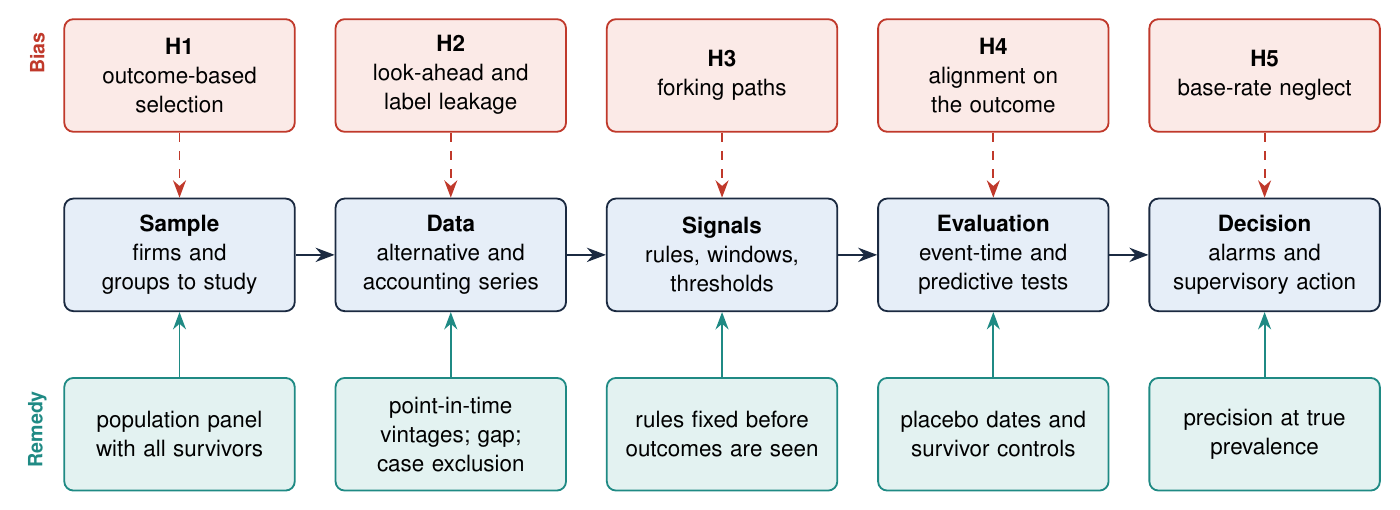
Let index firms (or business groups), calendar months, and indicate that firm ’s distress becomes public at . Let be the information available to a monitor at , and let be a candidate signal. A foresight claim is a statement about the conditional probability evaluated on the full population of firms that the monitor could have watched. Retrospective studies instead estimate quantities such as —a hit rate among known failures—using signals, thresholds and windows chosen after observing . Five channels drive a wedge between the two.
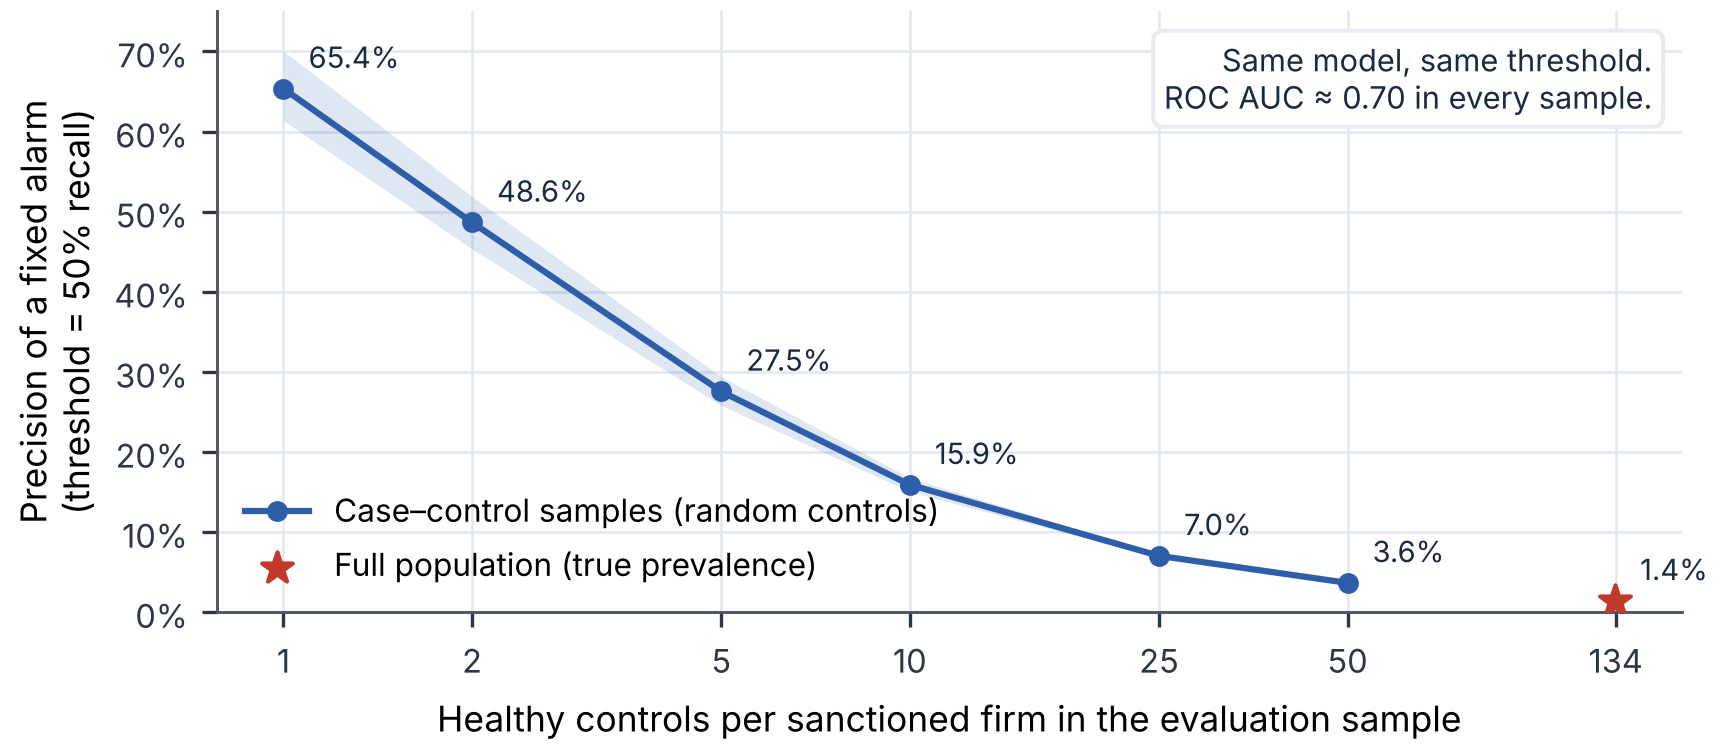
Outcome-based selection. Cases are selected because they failed, and controls are absent or few. Hit rates among failures say nothing about false alarms among survivors, and precision computed in a case–control sample with controls per case is inflated relative to the population by roughly the ratio of the sample prevalence to the population prevalence.
Look-ahead and label leakage. Training or evaluation uses information not in : future observations, revised data, or labels that were only revealed later. Serial misconduct is a special case: when the same fraud spans several years, a random split places part of one case in training and the rest in testing.
Forking paths. The analyst searches over many series, windows, thresholds and directions and reports the combination that fits the known failures best. With candidate series the maximum in-sample hit rate rises with even when no series is informative.
Alignment on the outcome. Averaging paths in event time around produces a smooth pre-event decline whenever failure is defined by the level of the same latent state, regardless of whether deterioration was predictable from earlier changes.
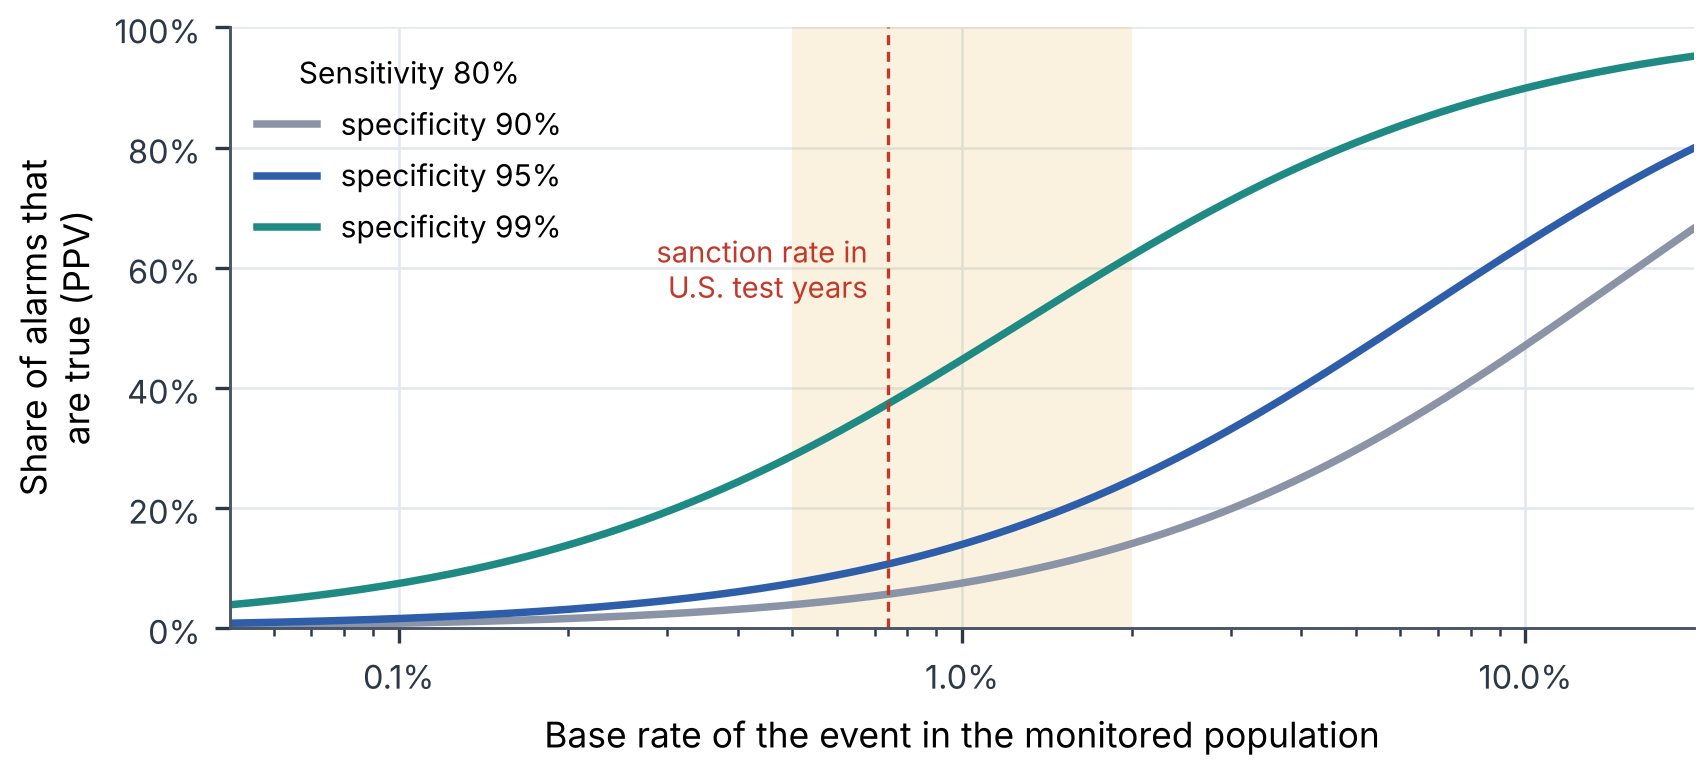
Base-rate neglect. With sensitivity , specificity and base rate , the share of alarms that are correct is which is small for the base rates relevant to listed firms even when and are high.
Figure 1 places the five channels on the research pipeline. The design principle that follows is simple: every quantity reported as evidence of foresight should be computable from alone, on a population sample, with signal definitions fixed before outcomes are examined.
4 Data and research design
4.1 A taxonomy of alternative data for early warning
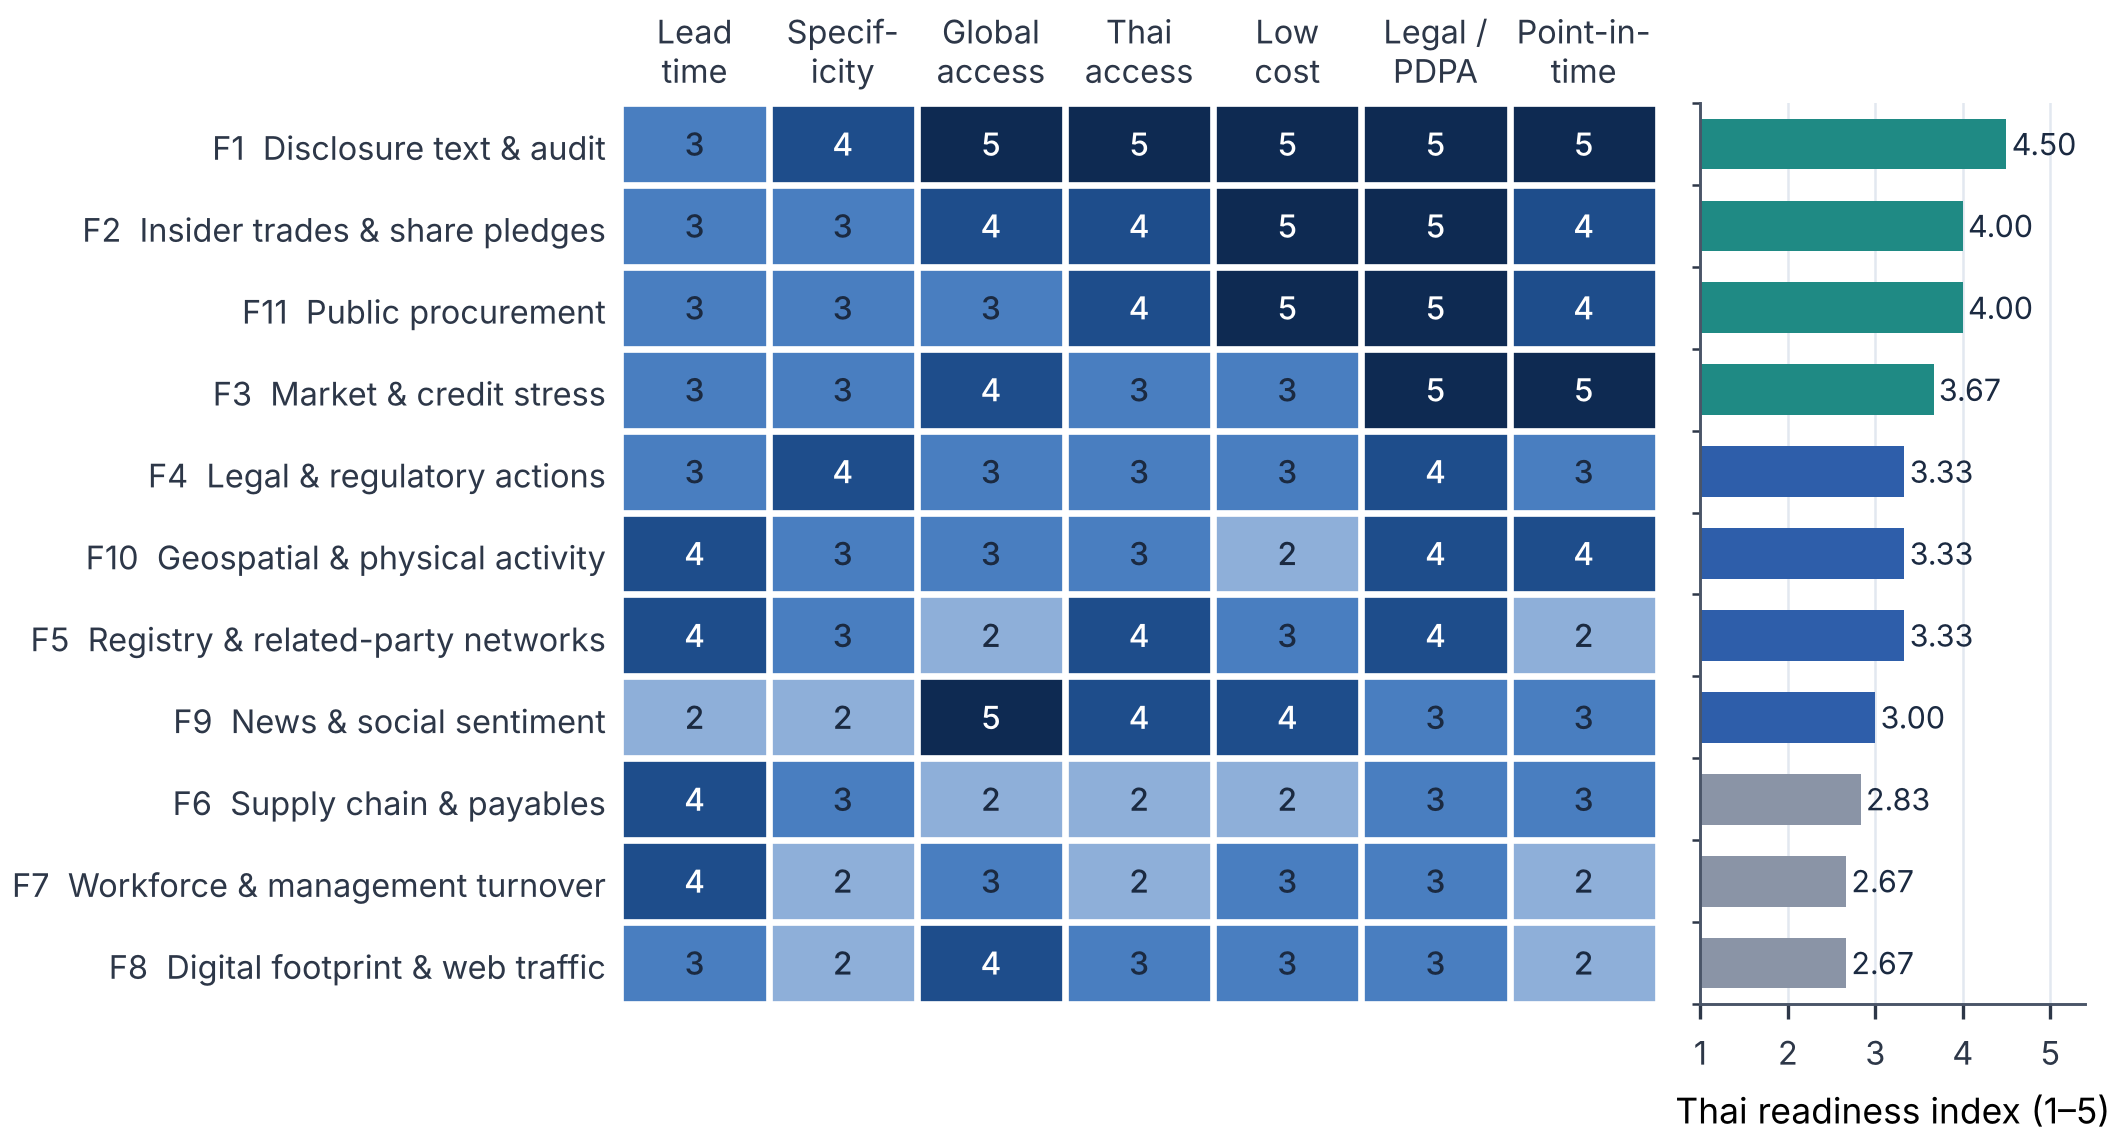
Table 1 defines eleven families of alternative data, with global examples and their nearest Thai counterparts. I score each family from 1 (weak) to 5 (strong) on seven criteria: lead time (how far ahead of revelation the family can plausibly move), specificity (how rarely it fires for healthy firms), global and Thai accessibility, cost (5 = cheap), legal safety including the Personal Data Protection Act B.E. 2562 (2019), and point-in-time integrity (whether historical values can be reconstructed as they were known at the time). A Thai readiness index averages the six criteria other than global access. The scores are the author’s structured assessment, intended as a transparent starting point rather than a measurement; the scoring file is part of the replication package so that others can contest individual cells.
Table 1. Alternative-data families considered in this paper.
| Family | Global examples | Thai counterpart (illustrative) | |
|---|---|---|---|
| F1 | Disclosure text & audit | Report tone and changes, auditor switches, key audit matters, late filings | One Report (Form 56-1), SET news, auditor opinions, exchange trading signs |
| F2 | Insider trades & share pledges | Insider sales, pledged shares, margin calls | SEC Form 59 and Form 246-2 filings, pledge disclosures |
| F3 | Market & credit stress | Short interest, CDS, bond spreads, failed issues | SET short-sale statistics, ThaiBMA yields, bondholder meetings, ratings |
| F4 | Legal & regulatory actions | Investigations, lawsuits, enforcement releases | SEC Thailand enforcement, Central Bankruptcy Court, Legal Execution Department |
| F5 | Registry & related-party networks | Shell entities, director interlocks, ownership chains | DBD corporate registry: directors, shareholders, capital changes |
| F6 | Supply chain & payables | Supplier-finance usage, overdue commercial paper, customs flows | Customs statistics, supplier disputes, trade-credit information |
| F7 | Workforce & management turnover | Job postings, layoffs, executive and director departures | Job boards, director resignations reported to SET |
| F8 | Digital footprint | Web traffic, app downloads, on-chain flows | Thai web and app usage panels |
| F9 | News & social sentiment | Press coverage, investigative journalism, social media | Thai news archives, Pantip, social platforms |
| F10 | Geospatial & physical activity | Satellite imagery, foot traffic, shipping, flying hours | Construction progress, property supply, plant activity |
| F11 | Public procurement | Contract awards, debarments | e-GP procurement records |
4.2 Case corpus and coding protocol
The case corpus contains 24 failures (19 outside Thailand and 5 Thai cases, one of which aggregates the 1997 finance-company closures) and four turnarounds (three global, one Thai). For each case I record three dates at monthly resolution: the first publicly documented signal, the revelation (the first unambiguous public disclosure of distress or misconduct) and the terminal event (bankruptcy, liquidation, administration, default or delisting). For turnarounds the corresponding dates are the first public recovery signal, the distress date and the confirmed recovery. Each of nine signal families is coded 0 (no documented public signal before revelation), 1 (a public signal less than twelve months before revelation) or 2 (a public signal twelve or more months before); the code-2 rule is checked mechanically against the recorded dates. The nine coded families collapse F8 and F9 into one and omit procurement, for which no case has a documented signal.
Three rules guard against hindsight in the coding. Only information that was public at the time counts, so facts that surfaced later in court are excluded. Signals are coded at the family level, not as the specific series an analyst might wish they had watched. And every case carries a confidence flag (High, Medium, Low) reflecting how well documented the dates are. The corpus was compiled from the author’s knowledge of the public record without access to news databases during drafting; all dates should therefore be verified against primary sources before the case evidence is used beyond illustration. Three of the five Thai failures and the Thai turnaround carry a Low flag for this reason. The full list is in Appendix A.
4.3 A public panel with enforcement labels
Case studies cannot measure false alarms because they contain no survivors. To quantify hindsight on a population I use the public release accompanying Bao et al. (2020): 146,045 U.S. firm-years from fiscal 1990 to 2014, with 28 raw Compustat items, 14 financial ratios, and an indicator that the firm-year was later the subject of an SEC Accounting and Auditing Enforcement Release (AAER). I drop 1990 and use 1991–2014 (141,463 firm-years). Misreporting revealed through enforcement is a narrower event than failure, but it is the archetype of the “hidden in plain sight” story, labels are assigned by an external authority, and the gap between misconduct and revelation makes leakage especially easy to commit.
I estimate two models. The first is a gradient-boosting classifier (histogram-based trees, 300 iterations, learning rate 0.05, 15 leaves, balanced class weights) on the 28 raw items, close in spirit to the ensemble of Bao et al. (2020). The second is a balanced logistic regression on the 14 ratios, winsorised at the 1st and 99th percentiles of the training sample. I evaluate both on fiscal years 2003–2008, the test window of Bao et al. (2020), under four designs of increasing honesty: (i) random five-fold cross-validation over all years; (ii) out-of-time training on all years up to ; (iii) training up to , which leaves a one-year buffer for labels to be revealed; and (iv) design (iii) plus removal from the training sample of every firm-year belonging to an enforcement case that also appears in test year . I report ROC AUC with bootstrap confidence intervals stratified by class, average precision, and precision and recall among the 1% of firm-years with the highest score.
4.4 Simulation design
Four Monte Carlo experiments isolate channels H3–H5 where the truth is known.
4.4.0.1 S1: forking paths
A researcher examines candidate monthly series for 25 known failures over the 36 months before failure. All series are pure noise: stationary AR(1) processes with coefficient 0.8 and unit variance. For each series the researcher searches 36 rules (windows of 3, 6, 12 or 24 months; thresholds of 2, 2.5 or 3 standard deviations; upward, downward or two-sided excursions), keeps the rule and series with the highest share of failures that “flashed”, and reports that share. I then apply the chosen rule to 1,000 fresh failures and 4,000 healthy firms. Each configuration is repeated 200 times.
4.4.0.2 S2: alignment on the outcome
Log firm value follows a driftless random walk with monthly volatility 0.12 over 240 months; failure occurs at the first passage below . I compare failures aligned on their failure date with two benchmarks: survivors aligned on the month of their own lowest value (a placebo with no failure), and survivors at random dates.
4.4.0.3 S3: timeliness versus noise
Log value follows a random walk with firm-specific drift and monthly volatility 0.06 for 20,000 firms over 180 months; failure is first passage below . Audited accounts reveal value with a six-month reporting lag at quarterly frequency. An alternative-data signal reveals current value monthly with additive noise of standard deviation 0.05, 0.15 or 0.30. For each signal I fix the threshold that yields a 2% or 5% false-alarm rate among healthy firm-months and trace the share of failures already in alarm at each horizon before failure.
4.4.0.4 S4: base rates
I evaluate Equation (2) over base rates from 0.05% to 20%.
5 Results
5.1 Which alternative data are usable?
Figure 2 reports the scoring matrix. The families with the best combination of lead time and specificity—registry networks, supply-chain payables, workforce signals and geospatial activity—are also those with the weakest point-in-time integrity and, except for the corporate registry, the weakest Thai access. Disclosure and audit signals, insider and pledge filings, and public procurement are the most “ready” in Thailand: they are cheap, lawful, and time-stamped by the regulator, although their lead time is moderate. This trade-off frames the rest of the paper: the data that look most promising in hindsight are often the hardest to reconstruct as they were known at the time, which is exactly the condition under which hindsight bias flourishes.
5.2 What the case record shows
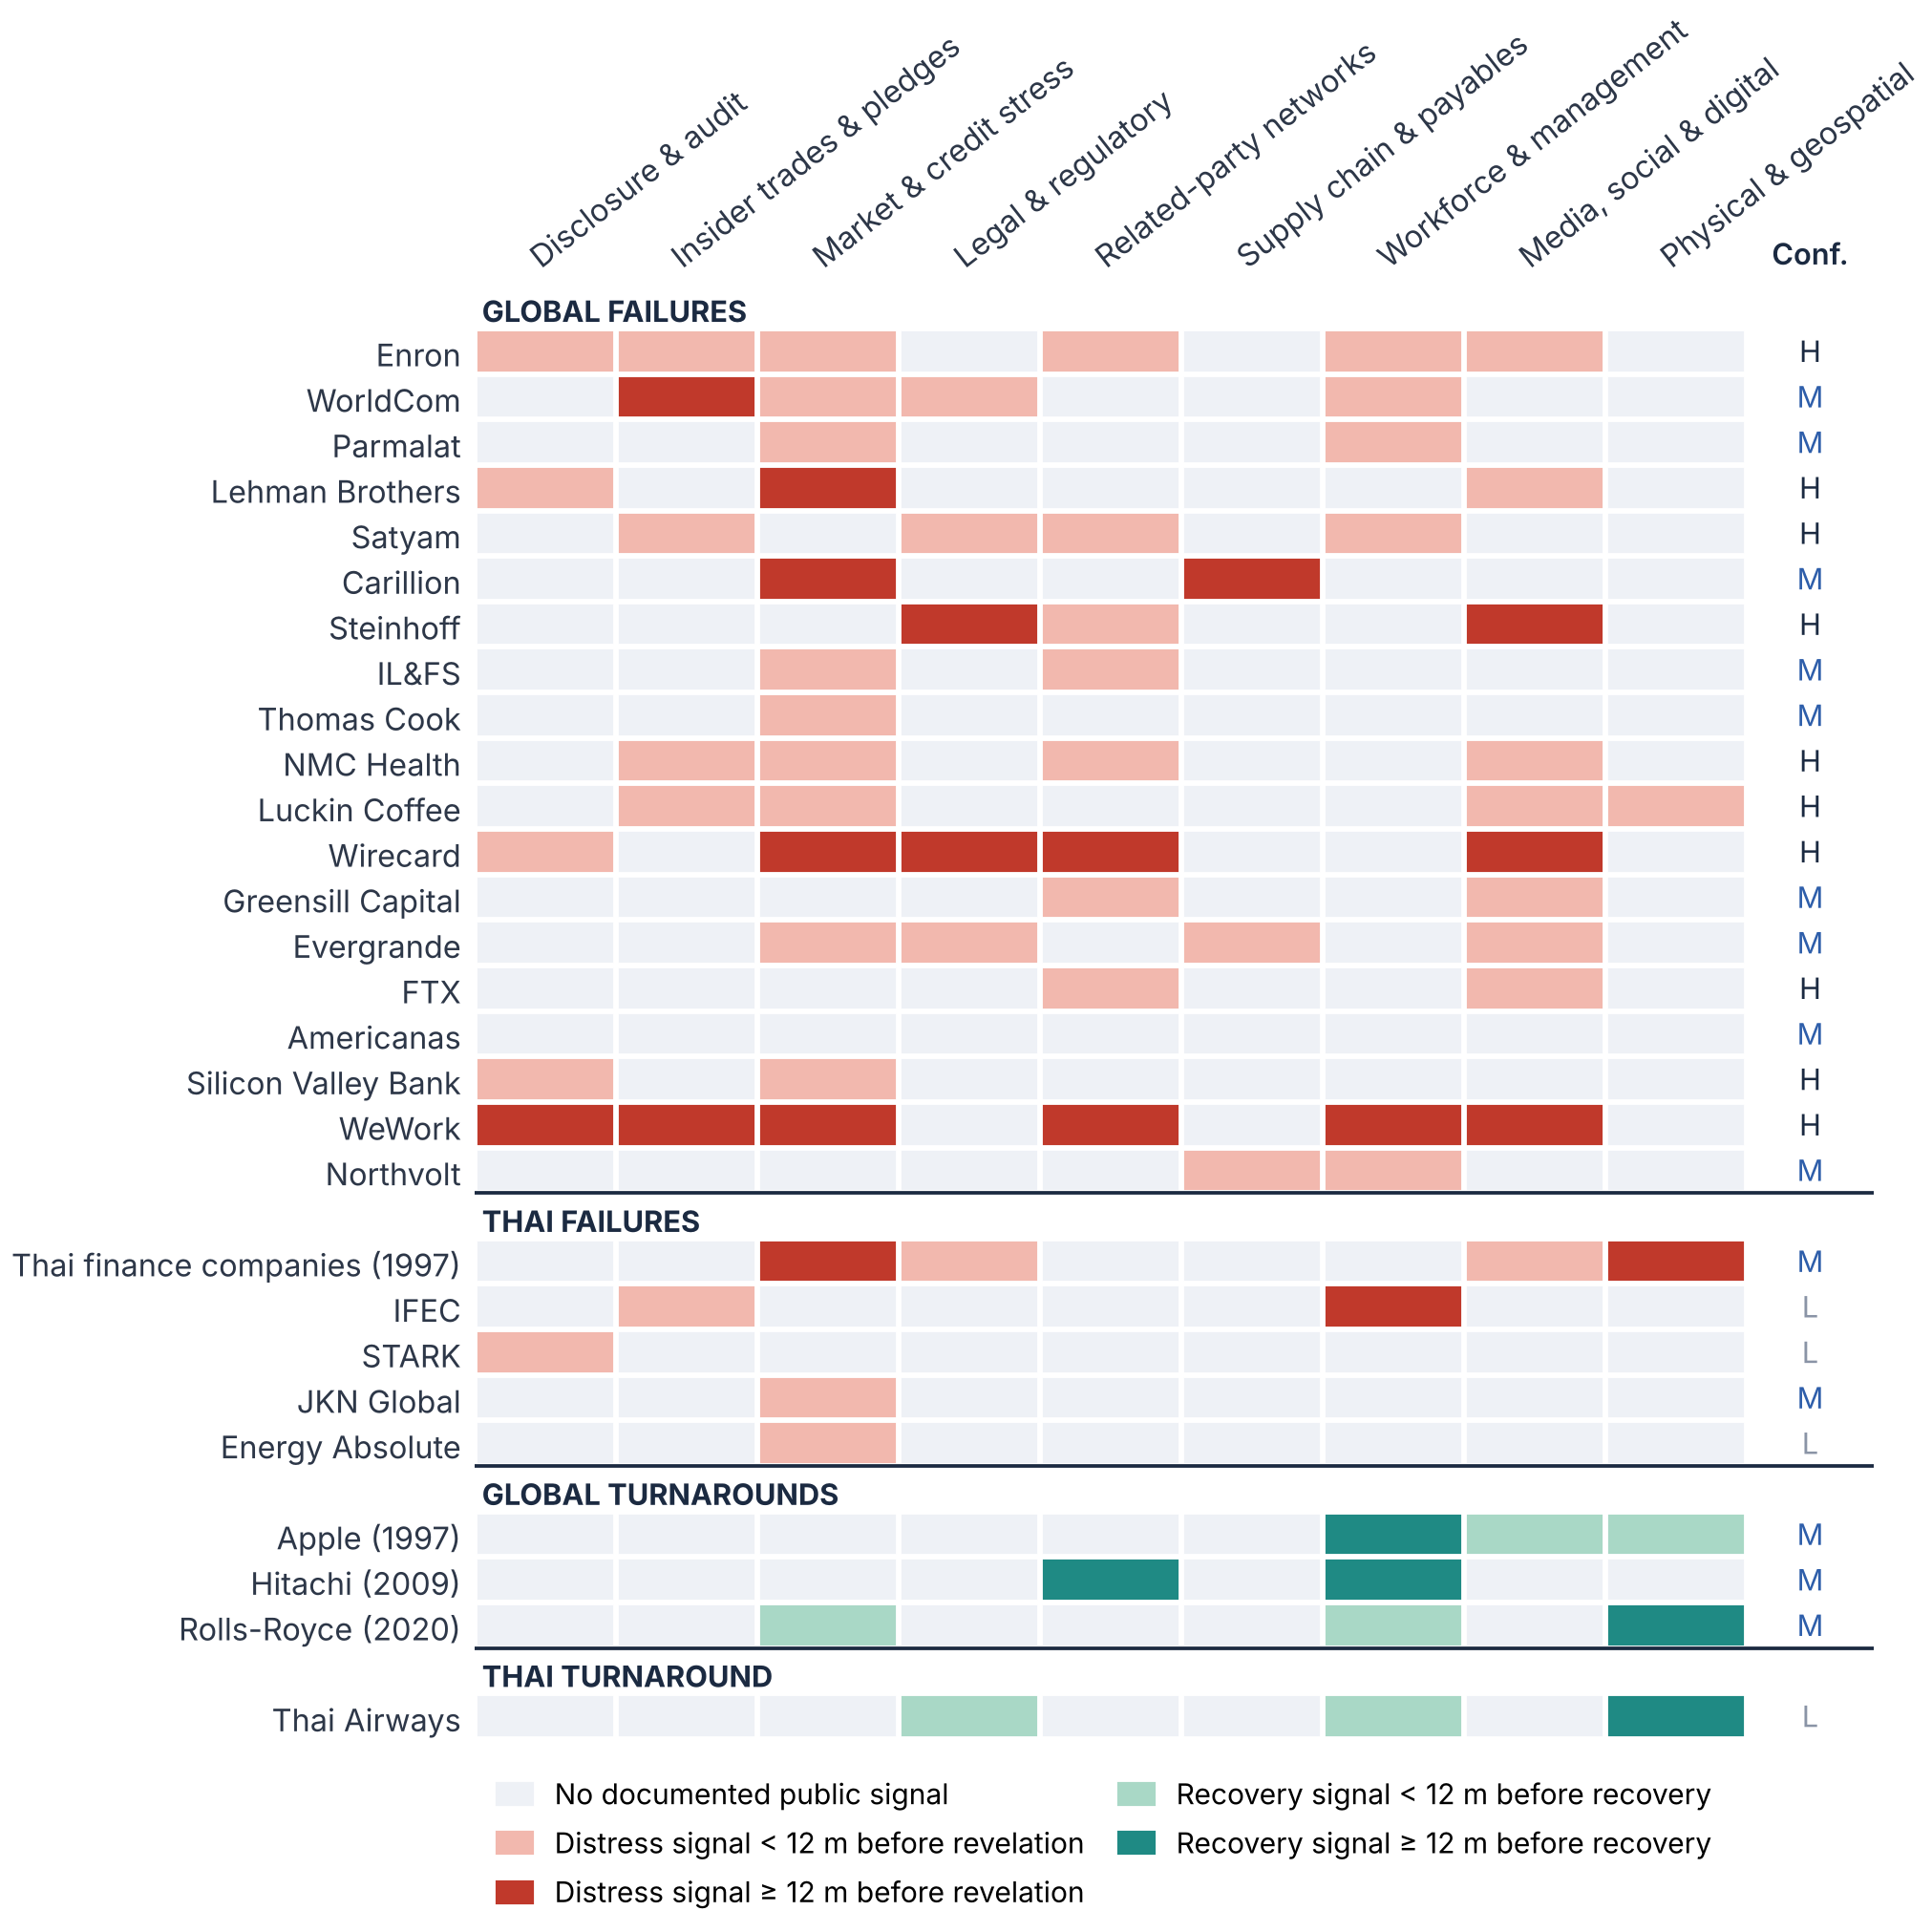
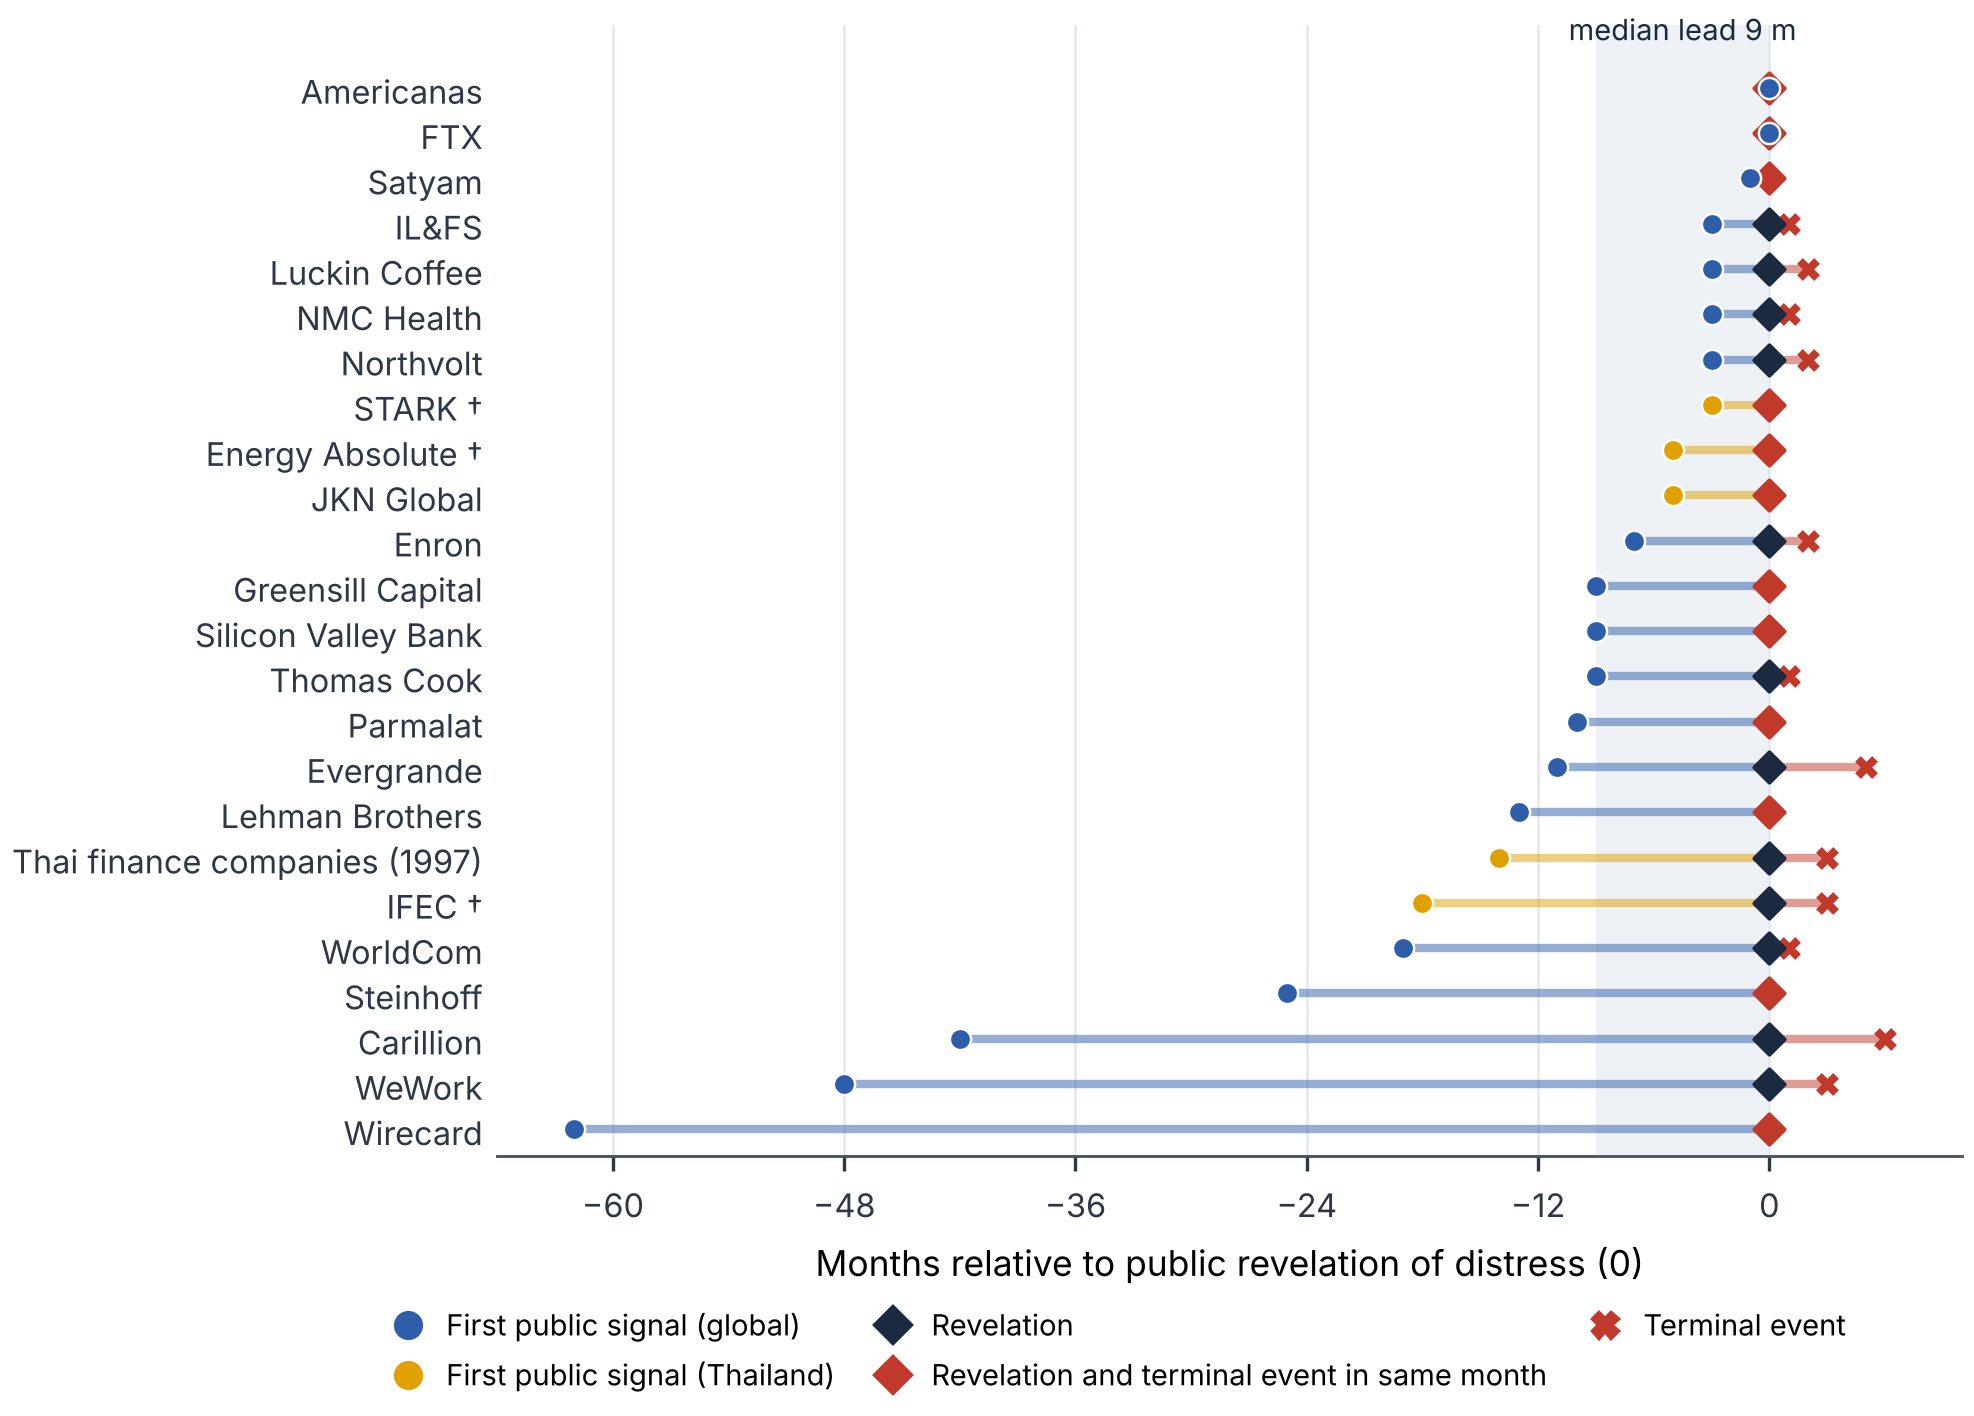
Figure 3 maps the coded signals and Figure 4 the timing of failures. Four regularities stand out.
Signals were usually present but rarely early. Twenty-three of 24 failures produced at least one public signal before revelation, with a mean of 2.8 families per case. Yet the median lead from the first public signal to revelation was nine months (mean 13.4), and only eight of the 24 failures gave a public signal at least a year ahead. Revelation and the terminal event usually fall within the same few months (median gap below one month), so warnings that come only at revelation leave little room to act.
Market and credit stress is the most common family, present in two thirds of failures and responsible for the largest number of signals a year or more ahead (Carillion, Lehman Brothers, Wirecard, WeWork and the 1997 Thai finance companies). This is consistent with the hazard-model finding that market variables carry information beyond accounts (Shumway 2001; Campbell et al. 2008) and with evidence that short sellers anticipate misconduct (Karpoff and Lou 2010). Media and investigative journalism come second (46%), followed by related-party networks (38%).
The longest leads are cases where many families fired together and the market was already sceptical. Wirecard combined investigative journalism, short-seller reports, a police raid and opaque third-party partners more than four years before revelation; WeWork’s prospectus disclosed related-party leases and governance problems four years before its bankruptcy. These are the cases that dominate the “signs were there” narrative—but they are also the cases in which markets had partly priced the risk, so the incremental value of alternative data is smallest where it is most visible.
Some failures were dark until the end. FTX and Americanas gave essentially no public warning before revelation, and several Thai cases (STARK, JKN Global, Energy Absolute) show leads of five months or less in the coded record. Physical, geospatial and supply-chain families—the archetypal “alternative” data—appear in few cases, most notably the store-traffic evidence in Luckin Coffee and property oversupply before the 1997 crisis. Turnarounds show the mirror image: leadership change and operating measures such as flying hours or restored capacity preceded confirmed recovery by a year or more.
5.3 How much skill survives honest evaluation?
Table 2 and Figure 5 report the leakage ladder on the U.S. panel. Under random cross-validation the gradient-boosting model reaches a ROC AUC of 0.833 and an average precision of 0.041, more than five times the prevalence of 0.74%. Each layer of realism removes part of that performance. Training only on past years lowers the AUC to 0.802; leaving a one-year buffer for label revelation lowers it to 0.764; and excluding training observations from the same enforcement case brings it to 0.697, close to the out-of-sample figures reported by Bao et al. (2020). Average precision falls from 0.041 to 0.014, and the share of sanctioned firm-years among the top 1% of scores falls from 6.3% to 2.3%. Measured against chance (AUC 0.5), roughly 40% of the apparent skill is an artefact of the evaluation design.
The logistic model on ratios behaves very differently: its AUC moves only from 0.690 to 0.675. The flexible learner gains far more from leakage because it can memorise firm-specific patterns—the balance-sheet fingerprint of a firm whose misreporting spans several years—that a linear model on scale-free ratios cannot exploit. Under honest evaluation the two models are statistically close, and the confidence intervals overlap. Flexible models are not useless, but their in-sample advantage is the most likely to be hindsight.
Table 2. The leakage ladder: test years 2003–2008, U.S. firm-years with SEC enforcement labels.
| Evaluation design | ROC AUC [95% CI] | SD across years | Average precision | Precision top 1% (%) | Recall top 1% (%) |
|---|---|---|---|---|---|
| Gradient boosting, 28 raw items | |||||
| Random 5-fold CV | 0.833 [0.810, 0.850] | 0.021 | 0.0411 | 6.25 | 8.43 |
| Out-of-time, train to | 0.802 [0.770, 0.828] | 0.049 | 0.0339 | 5.68 | 7.66 |
| Out-of-time, 2-year gap | 0.764 [0.732, 0.787] | 0.050 | 0.0229 | 4.55 | 6.13 |
| + serial-case exclusion (honest) | 0.697 [0.663, 0.721] | 0.039 | 0.0141 | 2.27 | 3.07 |
| Random 5-fold CV | 0.690 [0.660, 0.715] | 0.025 | 0.0142 | 3.12 | 4.21 |
| Out-of-time, train to | 0.685 [0.656, 0.709] | 0.025 | 0.0139 | 2.84 | 3.83 |
| Out-of-time, 2-year gap | 0.680 [0.651, 0.706] | 0.025 | 0.0134 | 1.99 | 2.68 |
| + serial-case exclusion (honest) | 0.675 [0.646, 0.701] | 0.024 | 0.0129 | 1.14 | 1.53 |
Notes: 35,166 test firm-years, of which 261 (0.74%) were later subject to an AAER. Confidence intervals from 400 class-stratified bootstrap resamples. “Serial-case exclusion” removes from the training set all firm-years of any enforcement case that also appears in the test year.
5.4 Sampling design and base rates
Figure 6 fixes the honest gradient-boosting model and a single threshold (the score above which half of the sanctioned firm-years fall) and varies only the composition of the evaluation sample. In a one-to-one case–control sample 65% of alarms are correct; with ten controls per case, 16%; in the full population, 1.4%. The ROC AUC is about 0.70 in every sample, because it is invariant to class proportions. This is channel H1 in its purest form: the same evidence can be presented as a highly accurate warning system or as one that is wrong 98 times in 100, depending only on how many survivors are included.
Figure 7 generalises the point using Equation (2). With 80% sensitivity and 95% specificity, about one alarm in nine is correct at the 0.74% sanction rate of the U.S. test years; even at 99% specificity the share is only 37%. For annual distress rates of listed firms in the range of 0.5–2%, any realistic early-warning system will generate several false alarms for every true one. Its natural role is to rank firms for human review, not to trigger automatic action.
5.5 Timing: when does risk become visible?
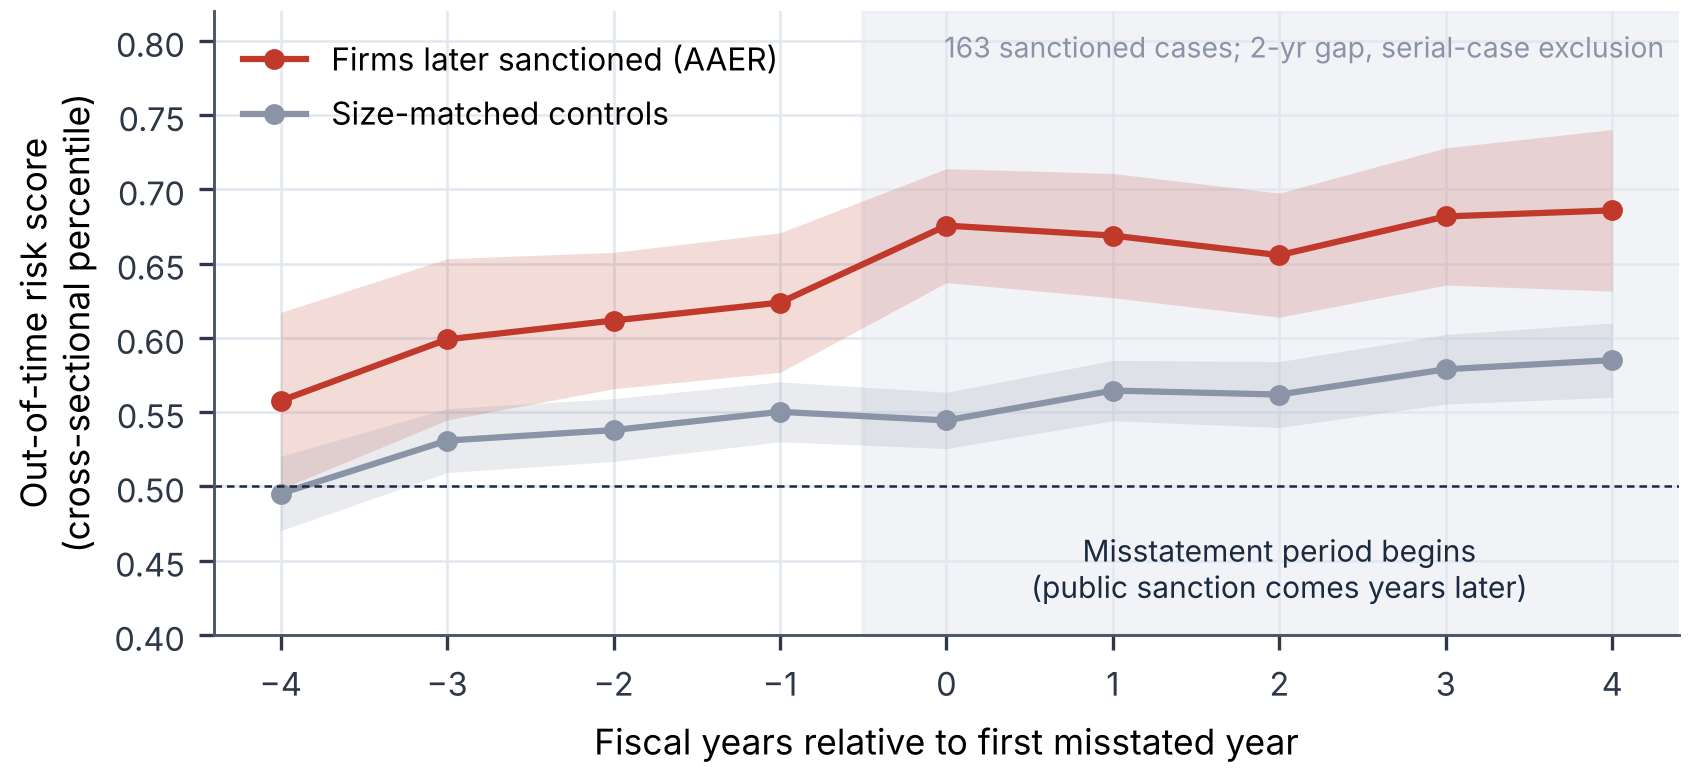
Figure 8 uses rolling out-of-time scores for 1997–2014 (two-year gap, serial-case exclusion) to trace the cross-sectional percentile of 163 enforcement cases around the first misstated year, against five size-matched controls per case. Sanctioned firms already sit about six percentile points above their controls four years before the misstatement begins, and the gap widens to about thirteen points in the first misstated year. A difference-in-differences between years and is about six percentile points. The pattern says that fundamentals identify firms that are prone to misreporting well before it starts, and add some information when it starts. Because enforcement typically follows years later, the elevated scores during the misstatement period represent genuine lead time relative to revelation. The magnitudes, however, are modest: the median sanctioned firm sits around the 65th–70th percentile, far from the extreme tail where a monitor would concentrate its attention.
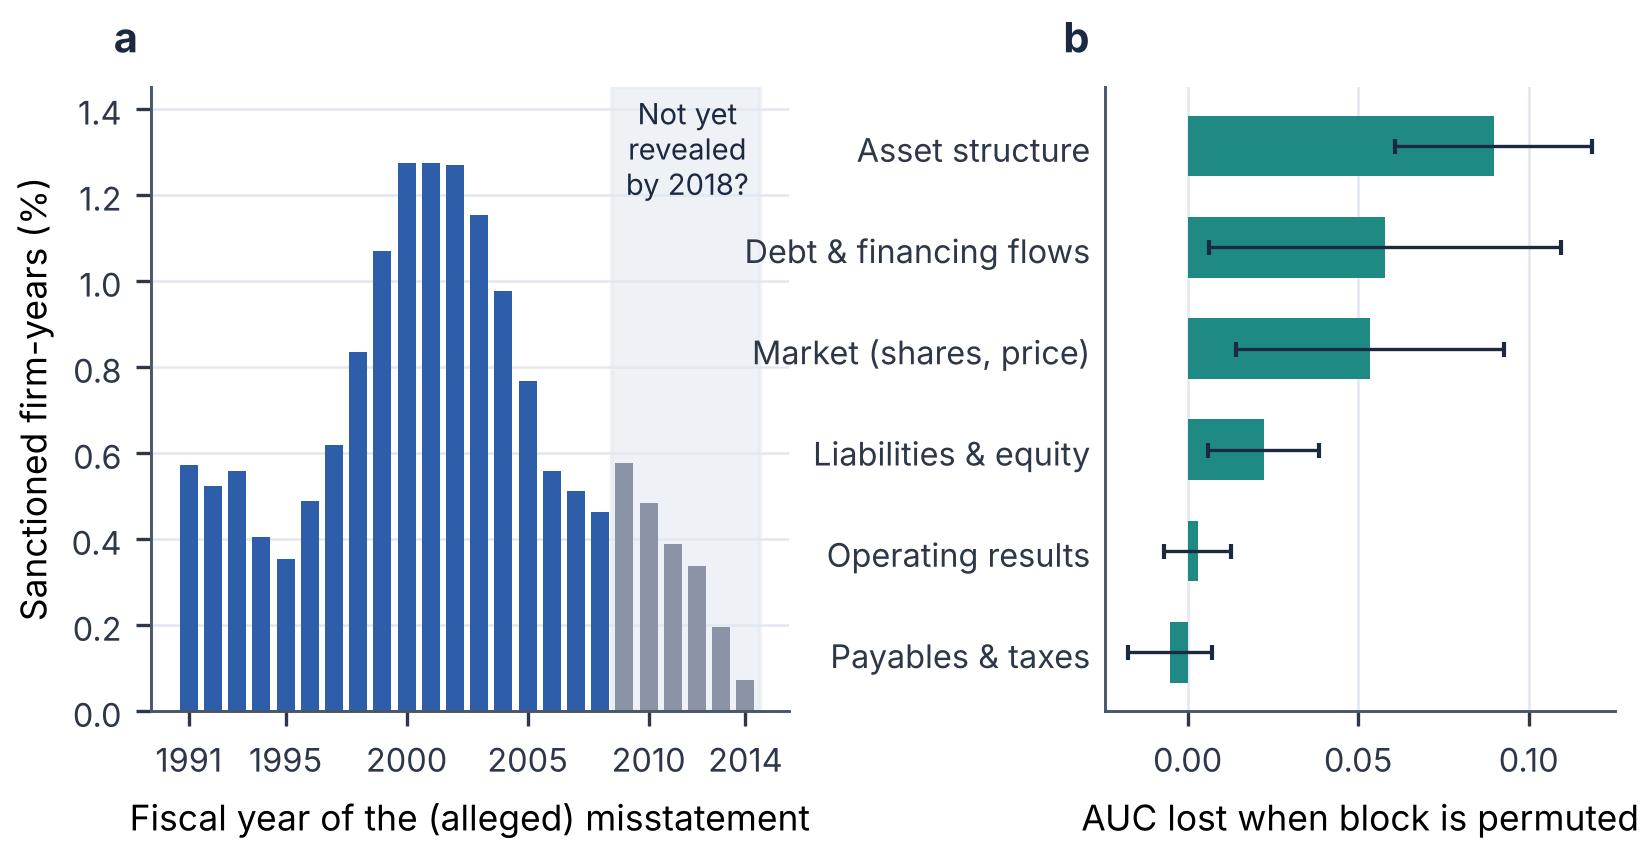
Figure 9a illustrates a subtler form of leakage. The share of firm-years later sanctioned peaks around 2000–2002 and falls steadily afterwards, reaching 0.07% in 2014. Part of this decline may be real, but part is right-censoring: misconduct committed in recent years had not yet been sanctioned when the labels were compiled. A model evaluated on recent years therefore appears better calibrated than it is, and any study that labels outcomes “as of today” inherits the problem. Figure 9b reports grouped permutation importance for the honest model. Asset structure carries the most information (an AUC loss of about 0.09 when permuted), followed by debt and financing flows and by market variables; operating results and payables add essentially nothing once the other blocks are known.
5.6 Simulation evidence
5.6.0.1 Forking paths (H3)
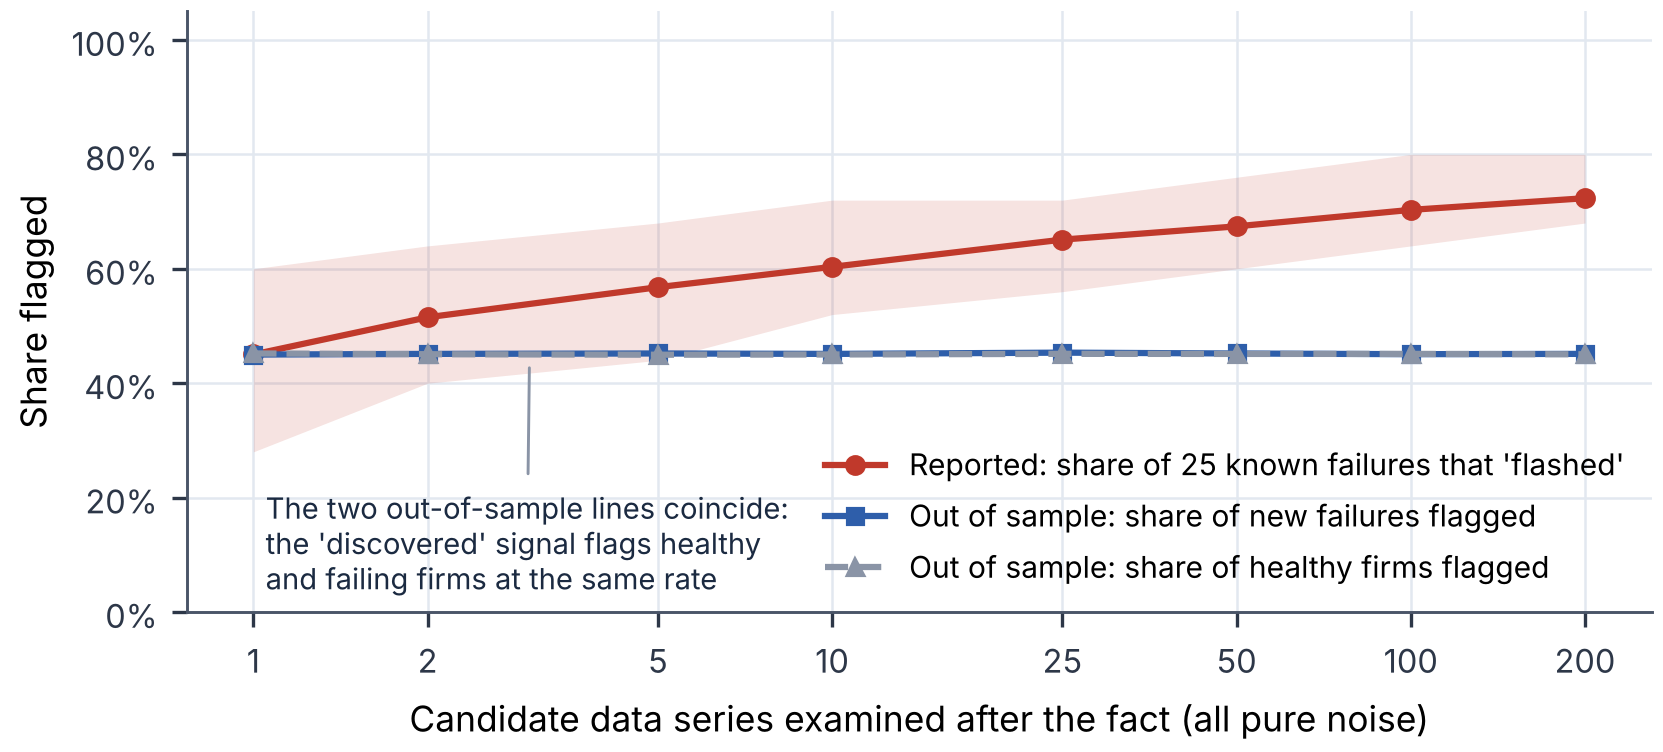
Figure 10 shows that with a single noise series the best of 36 rules flags 45% of known failures—and 45% of new failures and of healthy firms out of sample. Searching more series raises the reported hit rate steadily, to 60% with ten series and 72% with 200, while the out-of-sample rates stay at 45% for failures and healthy firms alike. A retrospective study that reports “72% of collapses were preceded by an abnormal signal” would be describing noise.
5.6.0.2 Alignment on the outcome (H4)
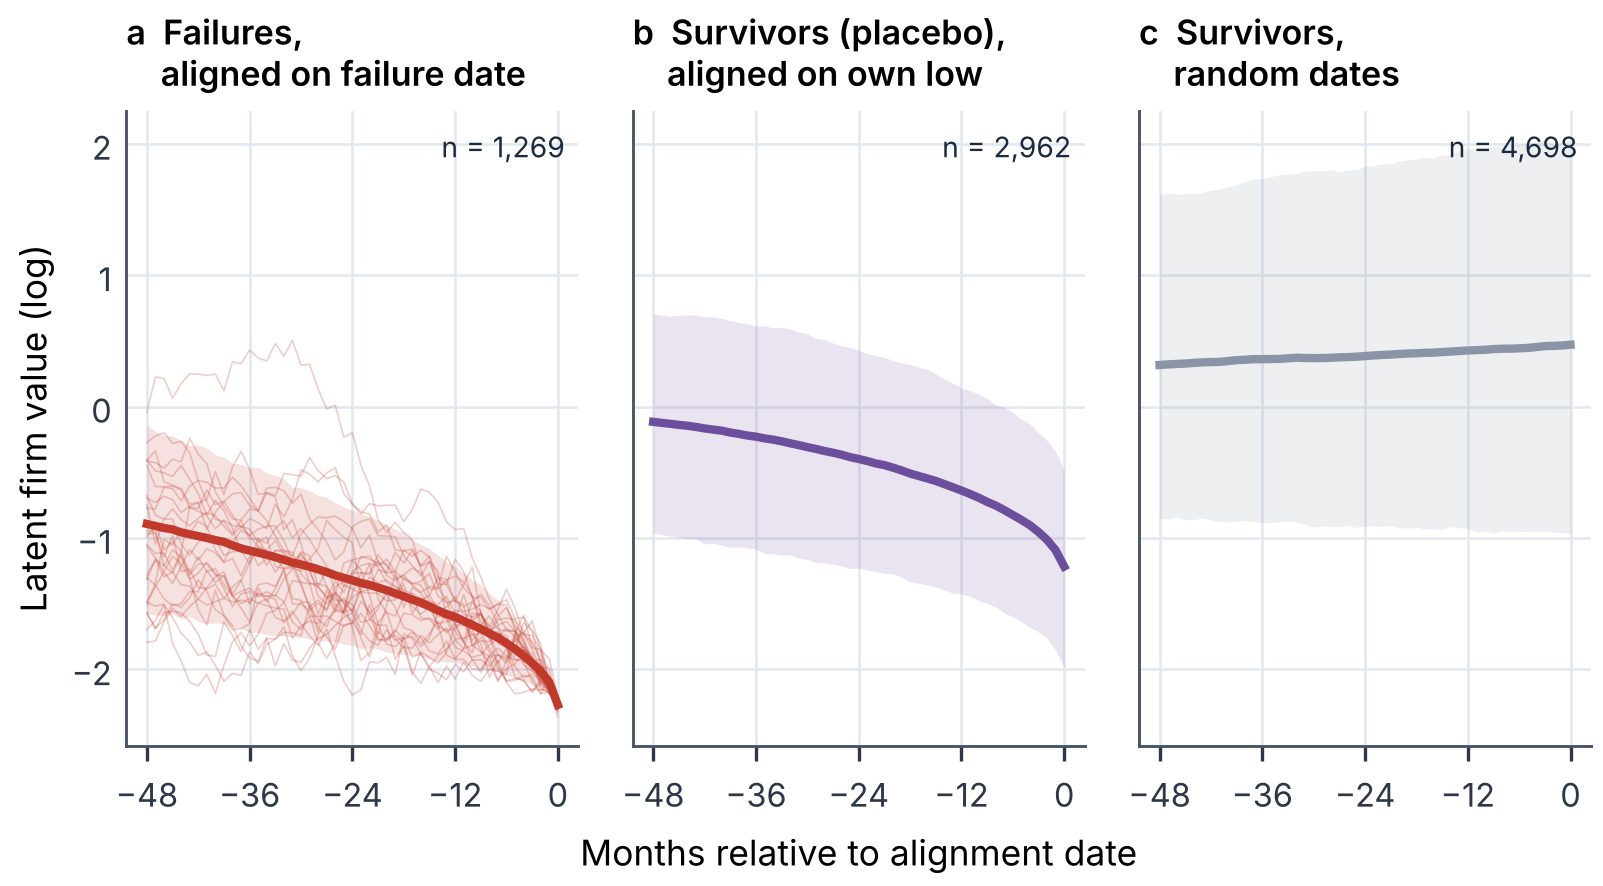
Figure 11a shows driftless firms aligned on their failure date. Their average value declines smoothly for four years before failure, from to , and the decline steepens near the event. Nothing in the model makes failure predictable from past trends: every firm has zero drift. Panel b produces the same shape for survivors aligned on their own lowest point, a placebo in which no failure occurs, while survivors at random dates show no trend at all. Event-time plots of failed firms therefore cannot, by themselves, establish that deterioration was foreseeable; they need placebo alignment and survivor controls.
5.6.0.3 Timeliness versus noise
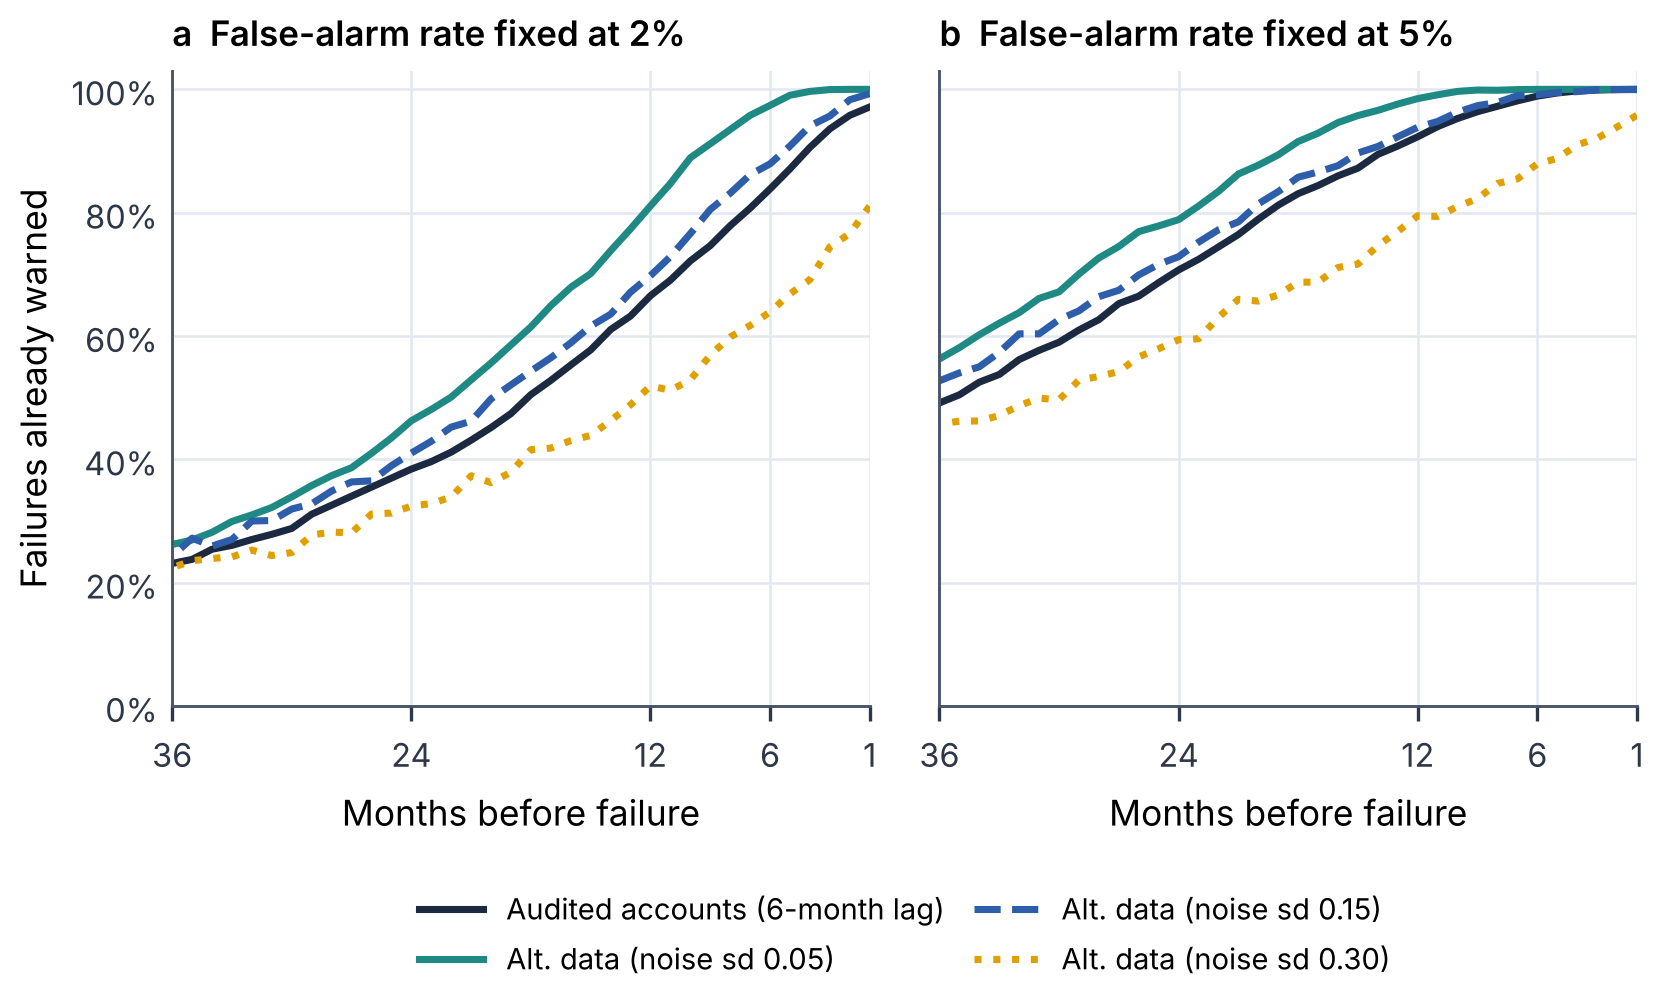
Figure 12 compares lagged audited accounts with a timely but noisy alternative signal. At a 5% false-alarm rate, accounts have already warned of 92% of failures twelve months ahead and 71% at 24 months. A low-noise alternative signal (standard deviation 0.05) improves these figures to 99% and 79%; a moderately noisy one (0.15) roughly matches the accounts; and a noisy one (0.30) is worse at every horizon, at 80% and 59%. Alternative data dominate audited accounts only when their measurement noise is small relative to the information lost through the reporting lag. Timeliness is the source of value, and noise is its price.
6 Implications for Thailand
6.1 Why the group is the right unit
Thai listed firms are frequently embedded in family-controlled groups with pyramids, cross-holdings and private affiliates (Claessens et al. 2000; Wiwattanakantang 2001). Several of the Thai cases in the corpus combine three features that firm-level monitoring misses: debt raised through listed entities and passed to related parties; controlling shareholders who pledge shares and face forced selling when prices fall; and funding that depends on rolling over short-term bills and debentures held by retail investors. Distress then appears first in the bond market or in a request to extend a maturity, while the listed entity’s accounts still look acceptable. An early-warning system for Thailand must therefore resolve entities to the group, aggregate exposures across it, and treat bond-market events as first-class signals.
6.2 Data landscape
The scoring in Figure 2 suggests a sequenced build. The first tier uses data that Thai regulators already hold with reliable timestamps: periodic and event disclosures to the SET and the SEC, insider-holding reports (Form 59) and acquisition-or-disposal reports (Form 246-2), auditor opinions and changes, trading signs, bond yields and bondholder-meeting notices from the Thai Bond Market Association, rating actions, and public procurement awards. The second tier links these to the corporate registry of the Department of Business Development to map directors, shareholders and capital changes across private affiliates, and to court and Legal Execution Department records. The third tier adds the costlier and noisier families—workforce, digital footprint, news and social media, geospatial activity—only where they demonstrably add information out of time. Under the Personal Data Protection Act, families that touch natural persons (workforce, social media, insider identities) require a documented lawful basis and data minimisation; aggregate and corporate data raise fewer concerns.
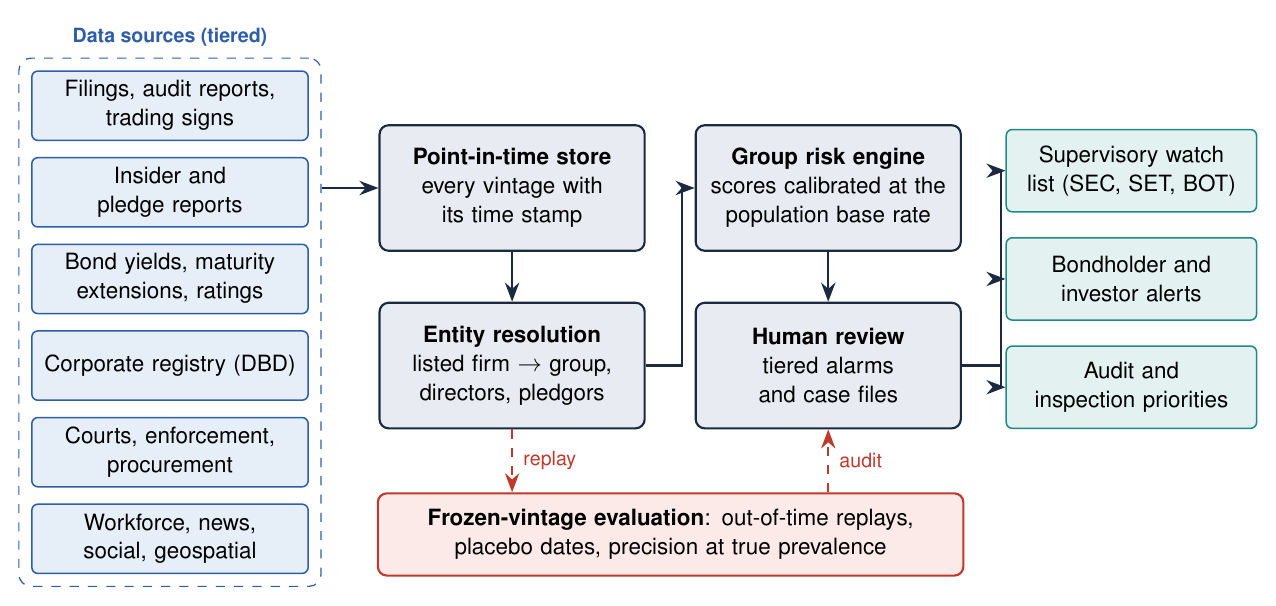
6.3 A point-in-time monitoring architecture
Figure 13 sketches an architecture that builds the remedies of Figure 1 into the system itself. Its central component is a point-in-time store that keeps every vintage of every series with the time at which it became known, so that any past date can be replayed exactly as the monitor would have seen it. Without such a store, every later evaluation of the system is exposed to channel H2.
6.4 Recommendations
Preserve vintages. Regulators and data providers should archive disclosures, registry records and market data with time stamps of first availability, and keep superseded versions. This is the precondition for any honest evaluation of an early-warning system and costs little relative to the analytics built on top of it.
Monitor groups, not tickers. Supervisors should maintain an entity-resolution layer linking listed companies to private affiliates, directors, guarantors and pledgors, and should aggregate debt and rollover needs across the group.
Make pledges and rollovers visible. Timely, machine-readable disclosure of share pledges by controlling shareholders, and of requests to extend debenture or bill maturities, would turn two of the most informative Thai signals into structured data.
Evaluate as a supervisor would have. Any vendor or in-house model should be validated out of time on frozen vintages, with a gap for label revelation, exclusion of serial cases, placebo dates, and precision reported at the true prevalence. AUC alone should not be accepted as evidence.
Use alarms to prioritise, not to act. Given base rates, alarms should feed tiered human review and inspection planning, with documented follow-up, rather than automatic sanctions or public flags.
Govern alternative data. Families involving natural persons require a lawful basis under the Personal Data Protection Act, minimisation and access controls; scraped data should be checked against platform terms. Corporate and aggregate data should be prioritised.
7 Limitations
Four limitations qualify the results. First, the case corpus is small, global cases are over-represented, and the coding was compiled from the author’s knowledge without news-database access; dates and codes should be verified, especially for the Thai cases flagged with low confidence. Its role is illustrative and descriptive, not inferential. Second, the population experiments use U.S. accounting data and enforcement labels, not alternative data or Thai firms. They measure how evaluation design inflates skill, which is a property of method rather than data, but the magnitudes for Thai alternative data may differ. Third, enforcement-based labels capture detected misconduct only; undetected fraud is coded as clean, which biases measured precision downward and makes the censoring problem in Figure 9a hard to separate from genuine change. Fourth, the scoring of alternative-data families is a structured judgement. I publish the scores so that they can be revised as Thai data access evolves.
A natural extension is to assemble a Thai population panel—all SET and mai listed firms with their disclosures, pledge reports, bond events and registry links, archived at monthly vintages—and to repeat the leakage ladder with alternative-data features. The code accompanying this paper is written so that such a panel can be dropped in with minimal changes.
8 Conclusion
Were the signs there? Usually, yes—but mostly late, mostly in market prices, and mostly in forms that also appear for firms that never fail. The evidence assembled here suggests three conclusions. Alternative data can extend warning horizons, but their value comes from timeliness and is quickly destroyed by noise. The apparent accuracy of retrospective studies is substantially inflated by the way they are designed, and the inflation is largest for the flexible models and the case–control samples that dominate the alternative-data literature. And for supervisors, the binding constraint is not a shortage of exotic data but the absence of point-in-time archives, group-level entity resolution and evaluation protocols that would allow any signal to be judged as it would have been seen at the time. Building those foundations is the most valuable first step for Thailand.
8.0.0.1 Data and code availability
All code, the coded case file, the scoring rubric and the derived results are provided in the accompanying repository. The U.S. panel is the public release of Bao et al. (2020), distributed by its authors on GitHub (JarFraud/FraudDetection); users should cite the original paper.
References
A Case corpus
Table 3. Coded cases. Outcome: F = failure, T = turnaround. For turnarounds the signal is the first recovery signal, “reveal” is the distress date and “terminal” is confirmed recovery. Confidence: H/M/L. All dates are at monthly resolution and should be verified against primary sources.
| Case | Country | Out. | Signal | First public signal | Reveal | Terminal | Conf. |
|---|---|---|---|---|---|---|---|
| Enron | United States | F | 2001-03 | Business-press article questioning opaque earnings and valuation | 2001-10 | 2001-12 | H |
| WorldCom | United States | F | 2000-11 | CEO margin calls on pledged shares and company loans to CEO reported | 2002-06 | 2002-07 | M |
| Parmalat | Italy | F | 2003-02 | Bond issue withdrawn amid investor scepticism; CFO change | 2003-12 | 2003-12 | M |
| Lehman Brothers | United States | F | 2007-08 | Credit spreads widen with subprime exposure | 2008-09 | 2008-09 | H |
| Satyam | India | F | 2008-12 | Aborted related-party acquisition; multilateral lender debarment; director resignations | 2009-01 | 2009-01 | H |
| Carillion | United Kingdom | F | 2014-01 | Persistently high short interest; extended supplier payment terms | 2017-07 | 2018-01 | M |
| Steinhoff | South Africa / Germany | F | 2015-11 | Prosecutors’ search of company offices reported | 2017-12 | 2017-12 | H |
| IL&FS | India | F | 2018-06 | Subsidiary payment delays and rating actions | 2018-09 | 2018-10 | M |
| Thomas Cook | United Kingdom | F | 2018-11 | Profit warnings and sharp bond-yield rise | 2019-08 | 2019-09 | M |
| NMC Health | United Kingdom / UAE | F | 2019-12 | Short-seller report on cash and related parties | 2020-03 | 2020-04 | H |
| Luckin Coffee | China | F | 2020-01 | Anonymous short report built on store-traffic video | 2020-04 | 2020-06 | H |
| Wirecard | Germany | F | 2015-04 | Investigative journalism on accounting; later short-seller reports | 2020-06 | 2020-06 | H |
| Greensill Capital | United Kingdom | F | 2020-06 | Reporting on client concentration in investment funds | 2021-03 | 2021-03 | M |
| Evergrande | China | F | 2020-08 | Regulatory leverage caps; leaked letter warning of cash crunch | 2021-07 | 2021-12 | M |
| FTX | Bahamas | F | 2022-11 | Leak of affiliate balance sheet; on-chain outflows | 2022-11 | 2022-11 | H |
| Americanas | Brazil | F | 2023-01 | No widely documented public signal before revelation | 2023-01 | 2023-01 | M |
| Silicon Valley Bank | United States | F | 2022-06 | Growing unrealised losses on held-to-maturity securities in filings | 2023-03 | 2023-03 | H |
| WeWork | United States | F | 2019-08 | IPO prospectus reveals losses and related-party leases | 2023-08 | 2023-11 | H |
| Northvolt | Sweden | F | 2024-06 | Major customer order cancellation reported | 2024-09 | 2024-11 | M |
| Thai finance companies (1997) | Thailand | F | 1996-01 | Property oversupply and finance-company exposure; bank scandal; first corporate offshore default | 1997-03 | 1997-06 | M |
| IFEC | Thailand | F | 2018-06 | Board and shareholder conflict; management turnover | 2019-12 | 2020-03 | L |
| STARK | Thailand | F | 2023-03 | Annual financial statements not filed on time | 2023-06 | 2023-06 | L |
| JKN Global | Thailand | F | 2023-06 | Debenture maturity extension sought | 2023-11 | 2023-11 | M |
| Energy Absolute | Thailand | F | 2024-01 | Share-price slide and debt concerns | 2024-06 | 2024-06 | L |
| Apple (1997) | United States | T | 1997-08 | Leadership change and strategic investment | 1997-07 | 1998-10 | M |
| Hitachi (2009) | Japan | T | 2009-04 | New leadership; portfolio restructuring | 2009-03 | 2011-03 | M |
| Rolls-Royce (2020) | United Kingdom | T | 2021-06 | Recovery in large-engine flying hours | 2020-10 | 2023-12 | M |
| Thai Airways | Thailand | T | 2021-06 | Court-approved rehabilitation plan; capacity restored | 2020-05 | 2025-06 | L |
B Implementation details
B.0.0.1 Models
Gradient boosting uses scikit-learn’s HistGradientBoostingClassifier with 300 iterations, learning rate 0.05, at most 15 leaves, a minimum of 40 observations per leaf, penalty 1.0 and balanced class weights; missing values are handled natively. Logistic regression uses balanced class weights and on ratios winsorised at training-sample percentiles, median-imputed and standardised. No hyper-parameters were tuned on test years.
B.0.0.2 Event-time analysis
Rolling scores are produced for each year from 1997 to 2014 by a model trained through with serial-case exclusion. Event year zero is the first fiscal year flagged as misstated for each enforcement case; cases with event years in 2001–2013 are retained so that four pre-event years are scored. Controls are drawn without replacement from firms never sanctioned in the same total-asset decile and event year.
B.0.0.3 Reproducibility
All random procedures use fixed seeds. Running code/real_data.py, code/simulation.py, code/tables.py and code/figures.py in that order reproduces every number and figure; the full pipeline runs in under an hour on a single CPU core.